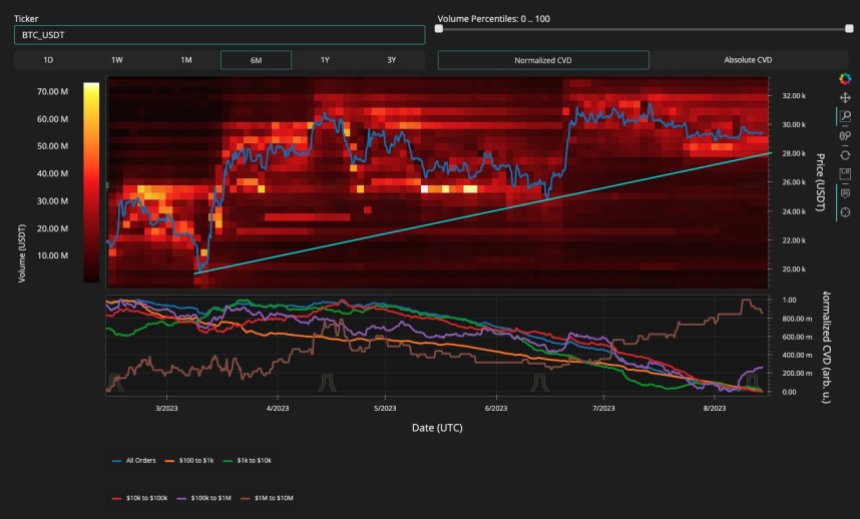
In the ongoing market turbulence on higher timeframes, Bitcoin (BTC) is at a crucial juncture as a great consolidation phase persists.
Research and analysis firm Material Indicators closely monitored the recent weekly candle close/open, paying particular attention to two key factors: the trend line and the 21-day, 21-week, and 21-month moving averages (MA) – all of which are currently influential in shaping market dynamics.
Uncertainty And Potential Turning Point For Bitcoin
The opening of the weekly candle below the trend line triggered a “subsequent nosedive,” amplifying concerns. While the 21-week and 21-month moving averages continue to serve as robust support, the 21-day MA has faced a rigorous seven-day testing period, according to the firm’s analysis.
Notably, the tight correlation of the 21-MA across three distinct time frames is rare, indicating that the market is at a critical inflection point.
Despite the compressed volatility witnessed in recent days, the price action observed over the past 24 hours exemplifies the market’s attempt to shake out weak hands.
According to Material Indicators, given the complexity of the current price action, it is prudent to zoom out and gain a broader perspective. Both Trend Precognition algorithms identified these moves on the four-hour chart, emphasizing the significance of adopting a comprehensive outlook.
Moreover, according to Materials, the order book reveals a concerning trend in bid liquidity, with less than $40 million holding the price up.
The absence of substantial liquidity below this level raises fundamental worries. However, it also suggests that there may not be sufficient sentiment to drive prices significantly lower – at least not yet.
In addition, Material Indicators highlights that the examination of liquidity movements within the order book over the past month paints a picture of continued price volatility with a potential upward bias.
However, the lack of volume raises concerns about the market’s overall health. Despite a $13 million buy wall at $27,900, the bottom of the channel at $28,300 remains a critical threshold for BTC to extend its current trend. The firm claims:
… the bottom of the channel at $28.3k remains my line in the sand for BTC to extend the trend, and I maintain that we must see weekly candles printing above the 100-Week MA to even consider a bull breakout.
BCT Faces Renewed Pressure Amid Strengthening US Dollar
As Bitcoin enters a new week of trading, market participants closely monitor the potential impact of the strengthening US Dollar Index ($DXY) on the world’s leading cryptocurrency.
According to Yan Alleman, co-founder of blockchain analytics firm Glassnode, recent developments suggest that BTC may face renewed pressure due to the upward momentum of the $DXY.
Alleman highlights that the $DXY’s renewed strength could exert downward pressure on Bitcoin’s price. Historically, there has been an inverse correlation between the value of the US Dollar and the price of BTC, meaning that when the dollar strengthens, Bitcoin often faces headwinds.
However, options pricing indicates a bullish sentiment for Bitcoin in the coming month. Options are financial derivatives that allow traders to speculate on the future price of an underlying asset, in this case, Bitcoin.
The pricing of options contracts suggests an expectation of a bullish move shortly. This aligns with the technical analysis indicating potential upside for Bitcoin.
Analyzing the potential price movements, Alleman notes that it would require nearly twice as much selling pressure to push Bitcoin down to the low $28,000 range compared to the buying pressure needed to surpass the $30,000 level.
This observation suggests that there may be greater support and buying interest at higher price levels, making a sustained drop less likely.
As of the time of writing, Bitcoin (BTC) is trading at $29,500, reflecting a marginal 0.4% increase over the past 24 hours.
Featured image from iStock, chart from TradingView.com