 Price Forecast: Eyeing the $3,400 Milestone")
Ethereum’s price trajectory is currently headed toward the next significant Fibonacci (Fib) levels, which are situated between approximately $2,400 and $2,600. This movement indicates a potentially critical phase in Ethereum’s market valuation.
Ethereum (ETH) is not performing as well as Bitcoin (BTC). However, if Ethereum begins to outperform Bitcoin, it could significantly increase ETH’s price, potentially reaching around $3,400. This possibility depends on the ETH/BTC pair dynamics, which market participants closely monitor for indications of Ethereum’s market trajectory.
Ethereum Price Outlook: Signs Point to a Positive Trend
In Ethereum’s monthly chart, the Moving Average Convergence Divergence (MACD) histogram has been ascending bullishly for four consecutive months, indicating a potential for the MACD lines to cross in a bullish manner soon. The Relative Strength Index (RSI) is currently in the neutral zone.
Ethereum has successfully surpassed its previous high of around $2,140 and is now advancing towards the next Fibonacci (Fib) levels, between $2,400 and $2,600. However, it might face initial bearish resistance at this juncture, potentially leading to a corrective phase.
However, if Ethereum breaks through this resistance bullishly, it could potentially ascend to the golden ratio level, around $3,400.
Ethereum Gains 50% in Value Over the Past Eight Weeks
Over the past eight weeks, the price of Ethereum has been consistently rising, showing an increase of over 50%. The weekly chart mirrored this upward trend, where the Moving Average Convergence Divergence (MACD) histogram exhibits bullish growth.
Read More: 9 Best AI Crypto Trading Bots to Maximize Your Profits
Additionally, the MACD lines are in a bullish crossover, while the Relative Strength Index (RSI) remains in neutral territory but is approaching overbought levels.
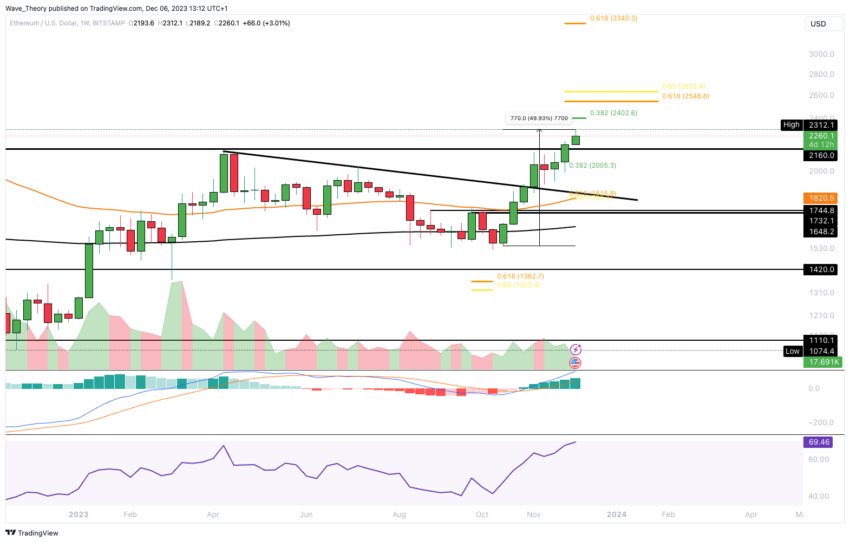
This situation implies that ETH might initially face resistance at the Fibonacci (Fib) levels between approximately $2,400 and $2,600.
Ethereum’s Daily Chart Reveals Bearish Divergence in RSI
The daily chart for Ethereum shows a bearish divergence in the Relative Strength Index (RSI), and the day has begun with a bearish trend. Should Ethereum enter a corrective phase, the next significant Fibonacci (Fib) support levels are anticipated at approximately $2,005 and $1,800.
Despite this, the daily chart also exhibits a golden crossover, indicating a bullish trend in the short to medium term.
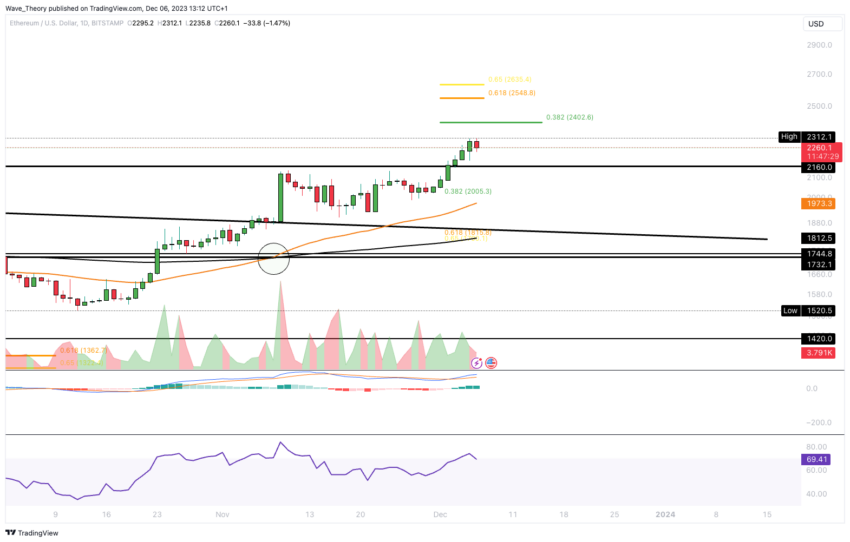
Furthermore, the Moving Average Convergence Divergence (MACD) histogram is trending upwards, and the MACD lines are in a bullish crossover, reinforcing the overall bullish sentiment.
Ethereum’s 4H Chart Shows Predominant Bearish Indicators
In the 4-hour (4H) chart for Ethereum, the indicators are predominantly bearish. There is a bearish crossover in the Exponential Moving Averages (EMAs), and the histogram of the Moving Average Convergence Divergence (MACD) is also trending downwards, indicative of bearish momentum.
Read More: Best Crypto Sign-Up Bonuses in 2023
Additionally, a bearish divergence is observed in the Relative Strength Index (RSI), suggesting a potential short-term correction for Ethereum. Despite this, in the medium term, the bullish price targets for Ethereum are set between approximately $2,400 and $2,600, and around $3,400.
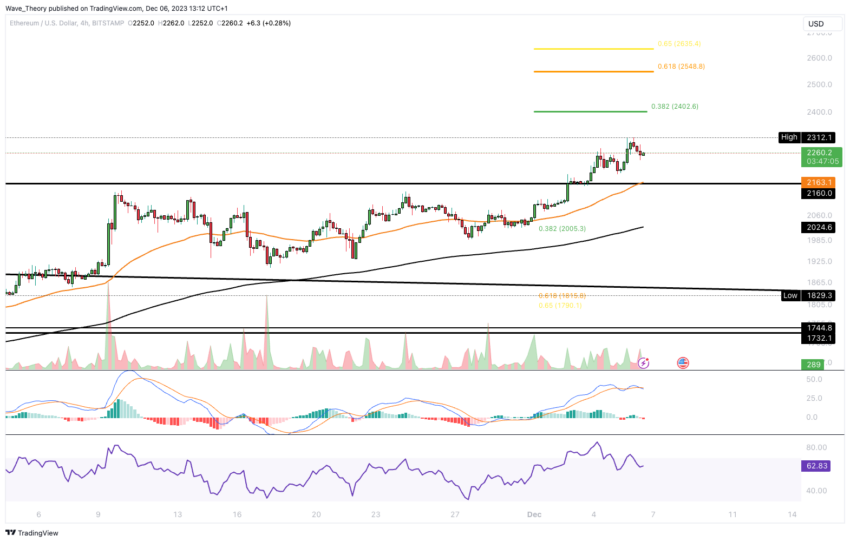
Furthermore, the presence of a golden crossover in the EMAs signals that the trend remains bullish in the short term despite the immediate bearish indicators.
Ethereum Versus Bitcoin: Clear Losses for ETH in Comparative Performance
In its trading pair with Bitcoin (BTC), ETH might extend its downward movement to reach the Golden Ratio support at approximately 0.043 BTC, indicating a potential further decline of about 19%.
Currently, Bitcoin’s price is increasing significantly faster than Ethereum’s, leading to a bearish outlook for Ethereum against Bitcoin.
In the monthly chart, the bearish trend is further supported by the Moving Average Convergence Divergence (MACD) histogram, which is ticking lower, and the MACD lines are crossed in a bearish pattern. Meanwhile, the Relative Strength Index (RSI) remains neutral.
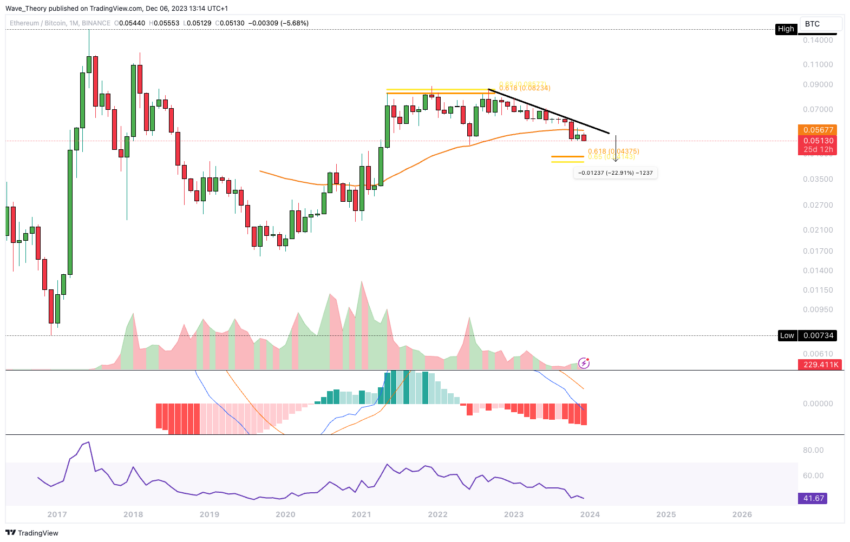
A conceivable scenario is that Bitcoin outperforms Ethereum, driving the ETH price to the Golden Ratio level of around 0.043 BTC. At this point, Ethereum could potentially experience a sharp rebound, possibly initiating Ethereum’s rally toward the $3,400 mark.
Read More: Top 9 Telegram Channels for Crypto Signals in 2023
Disclaimer
In line with the Trust Project guidelines, this price analysis article is for informational purposes only and should not be considered financial or investment advice. BeInCrypto is committed to accurate, unbiased reporting, but market conditions are subject to change without notice. Always conduct your own research and consult with a professional before making any financial decisions.


