
Bitcoin has failed three attempts to break above the $82,000 area, with short-term holders repeatedly selling into strength, according to a May 15 market brief from on-chain analyst Axel Adler Jr. The setup puts the market in a narrow technical and behavioral squeeze, where the 200-day simple moving average is acting as resistance while short-term holder profitability metrics remain stuck near break-even.
Adler’s latest Bitcoin Morning Brief frames the current structure as more than a standard resistance test. Price is trapped between the realized cost basis of short-term holders and the 200-day SMA, with each bounce drawing the same response from recent buyers: distribution rather than renewed conviction.
“Price is stuck between the realized cost basis level of short-term holders and the 200D SMA, and every bounce meets the same reaction: STH are using strength to exit, preventing the market from moving higher,” Adler wrote. “Together, the two charts show not just technical resistance, but a behavioral trap.”
The key level in Adler’s analysis is $82.1K, identified as the 200-day SMA and the upper boundary of the current resistance zone. Bitcoin has approached that level three times since April 2026, but each attempt ended in a pullback. Below spot, Adler points to the STH 1W-1M Realized Price at $77.9K as the main support reference, leaving Bitcoin compressed in a roughly $4,200 corridor.
Related Reading
That range matters because it combines a widely watched trend indicator with the cost basis of recent market participants. In Adler’s reading, the lack of abnormal volume spikes during the failed upside attempts suggests that buyers have not shown enough aggression to absorb the supply being offered near the top of the range.
“As long as price remains below $82.1K, the resistance structure stays intact,” the brief said. “Confirmation of a regime change would require a confident daily close above the 200D SMA alongside rising volume. Without that, every bounce remains a candidate for selling.”
Bitcoin STH SOPR Remains The Market’s Pressure Gauge
The second part of Adler’s argument centers on short-term holder SOPR, a metric that tracks whether recently moved coins are being spent at a profit or loss. According to the brief, STH SOPR has recovered from the extreme lows seen in February 2026, but it has still failed to hold sustainably above the 1.0 threshold.
That level is central to the current read. When STH SOPR moves toward 1.0 and rolls over, it suggests short-term holders are using rallies to exit around break-even rather than staying positioned for further upside. Adler said both the seven-day and 30-day moving averages are hovering near that boundary, reinforcing the idea that supply is reappearing exactly where a stronger rally would need confirmation.
Related Reading
“Every time price attempts to rise, SOPR briefly moves up toward 1.0, then quickly falls back again,” Adler wrote. “This means that STH are using rallies to exit rather than holding positions in anticipation of further upside. This pattern is a sign of a market where supply dominates demand in the break-even zone.”
The interaction between the two charts is the main point of the brief. Adler argues that the failed breakouts near $82.1K were accompanied by STH SOPR pushing toward 1.0 and then reversing, making the resistance zone both technical and behavioral. The 200-day SMA defines the chart barrier; short-term holder selling helps enforce it.
“This is not a coincidence, but a mechanism,” Adler wrote. “Resistance at $82.1K is being maintained not only technically through the 200D SMA, but also behaviorally — by STH themselves, who use this zone to sell whenever the market tries to move higher.”
Breakout Conditions Remain Narrow
For Adler, the bullish trigger is clear but unconfirmed. Bitcoin would need a decisive daily close above $82.1K, supported by rising volume, while the STH SOPR seven-day moving average would need to hold above 1.0 for several consecutive days. That combination would indicate not only a technical break of the 200-day SMA, but also a shift in short-term holder behavior from selling at break-even to holding positions in profit.
Until then, the current regime remains neutral with a cautious bias. A fourth rejection near the same zone would risk sending price back toward $77.9K, Adler’s cited short-term holder support level. If that support fails to hold, the brief warns that lower support levels could come back into view.
The market, in other words, is not waiting only for price to clear a line on the chart. It is waiting for recent buyers to stop treating that line as an exit.
At press time, BTC traded at $80,453.
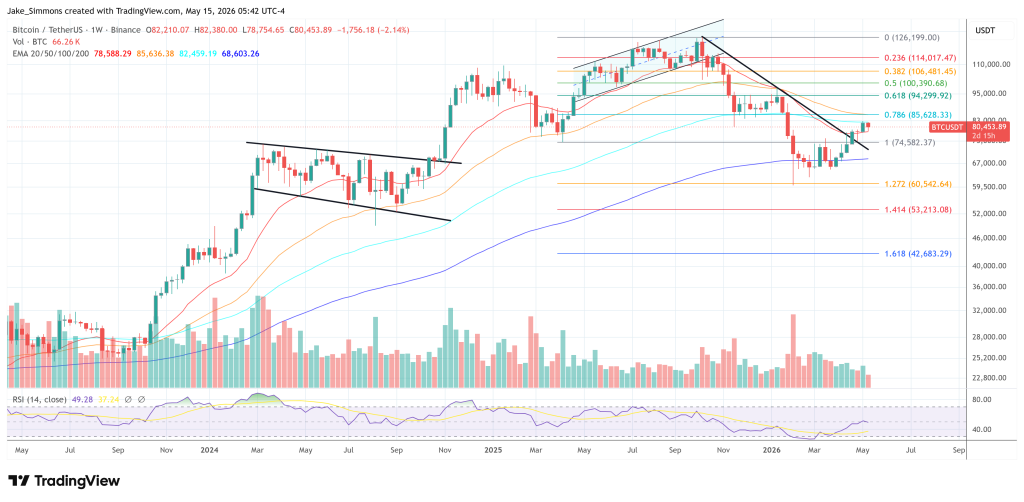
Featured image created with DALL.E, chart from TradingView.com