
Ethereum’s Market Value to Realized Value (MVRV) Ratio fell below the critical 0.8 threshold, placing the altcoin in a historically rare accumulation zone.
The on-chain metric suggested ETH traded below its realized value, a condition that previously appeared during major market bottoms.
According to the data, similar readings emerged in December 2018, March 2020, and June 2022 before Ethereum established cycle lows. That historical context renewed attention among long-term investors despite the absence of an immediate bullish catalyst.
However, the metric reflected valuation rather than future price direction. Instead, it suggested seller exhaustion had intensified after months of weakness.
As a result, Ethereum entered another period where long-term value investors historically became active, while broader market participants continued weighing macroeconomic uncertainty against improving blockchain fundamentals.
Inflows outweighed withdrawals despite recovery
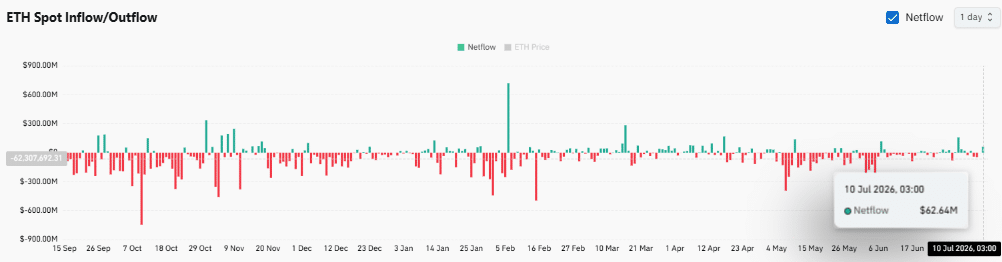
Spot flow data showed Ethereum recorded Exchange Netflows of approximately $62.64 million during the latest session. That reading indicated more ETH entered exchanges than left them, even as price stabilized above recent lows.
Such activity often reflected investors preparing assets for trading rather than demonstrating outright accumulation through exchange withdrawals.
However, the inflow remained relatively modest compared with larger historical spikes visible on the chart, suggesting exchange activity had not reached panic levels.
Meanwhile, Ethereum maintained its recovery without triggering aggressive selling pressure across spot markets.
The combination revealed a market that continued supplying exchanges with liquidity while buyers absorbed available inventory.
That balance prevented excessive downside pressure, although it also suggested traders remained willing to reposition holdings instead of committing entirely to long-term storage.
Leveraged traders increased their exposure despite softer funding
Derivatives activity strengthened as market participation expanded across perpetual futures.
Open Interest climbed 3.25% to $11.1092 billion, showing traders increased outstanding positions while Ethereum stabilized near current levels.
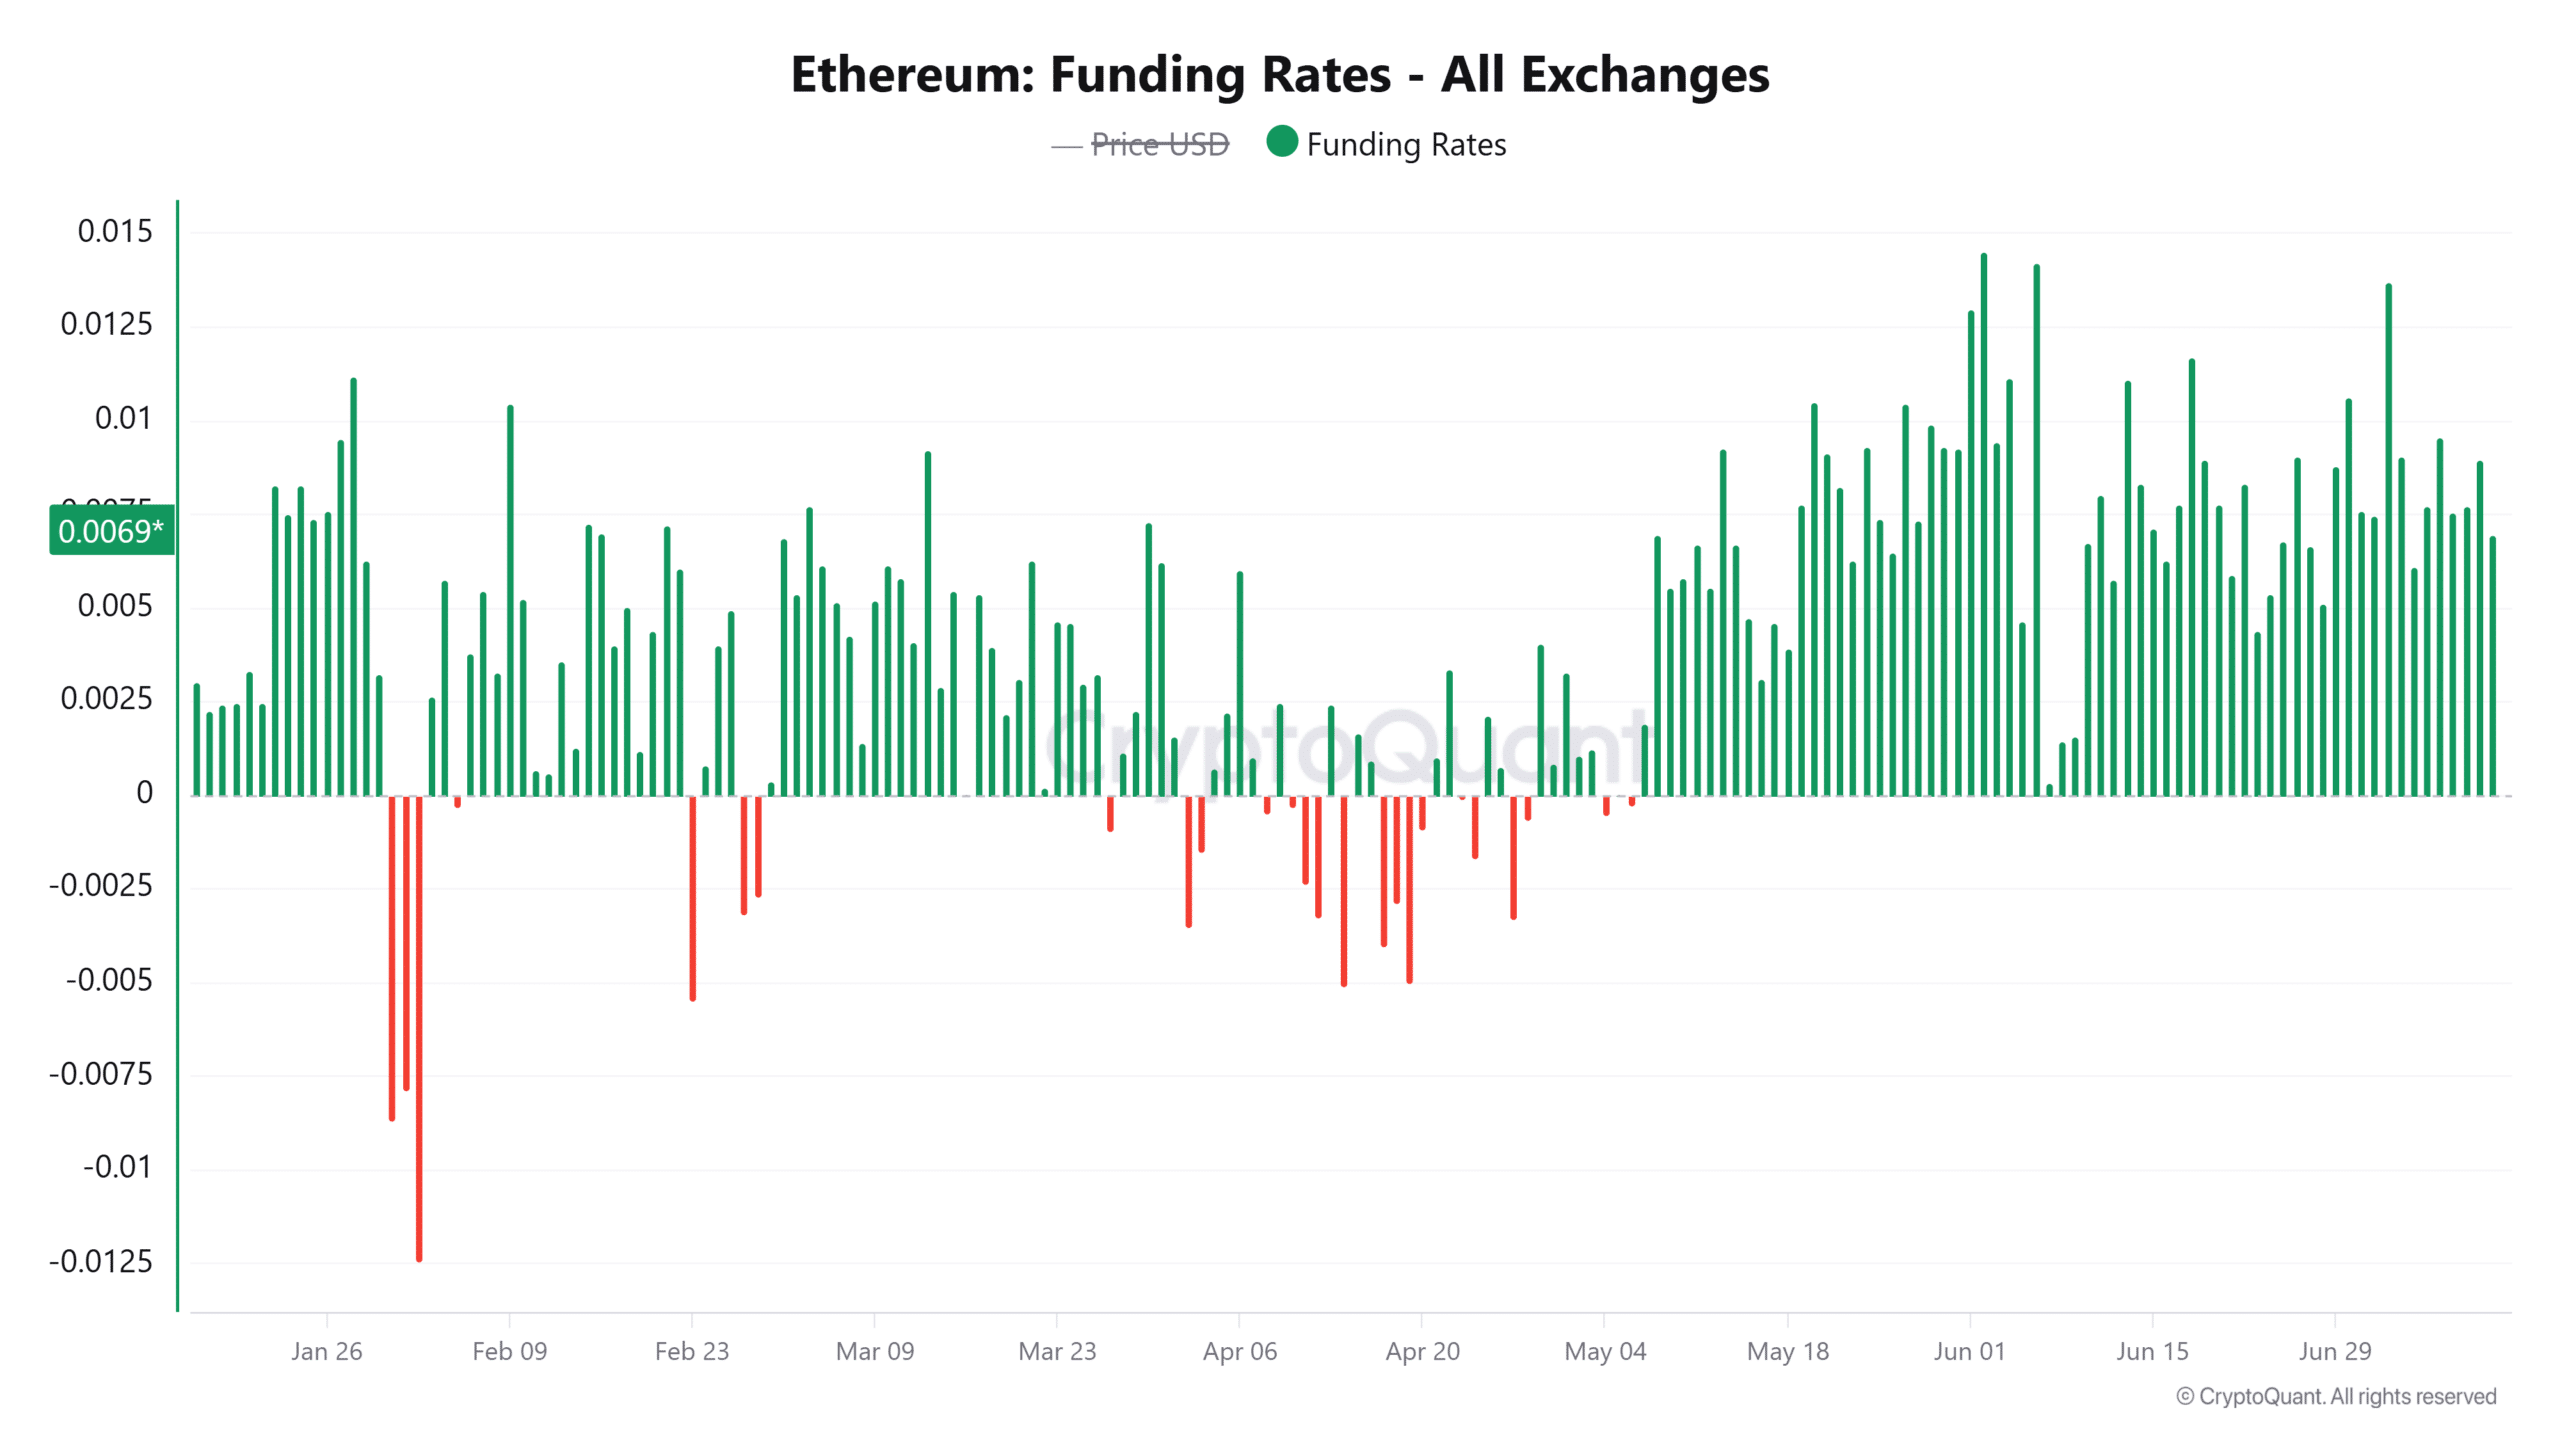
Funding Rates remained positive at 0.00699, although the metric declined 25.41% over the previous 24 hours. The combination indicated long traders still paid a premium to maintain positions, but bullish conviction eased compared with the prior session.
Instead of unwinding exposure, participants continued adding contracts while accepting a lower funding environment.
The derivatives market, therefore, reflected measured optimism rather than aggressive speculation.
Can Ethereum hold above reclaimed support?
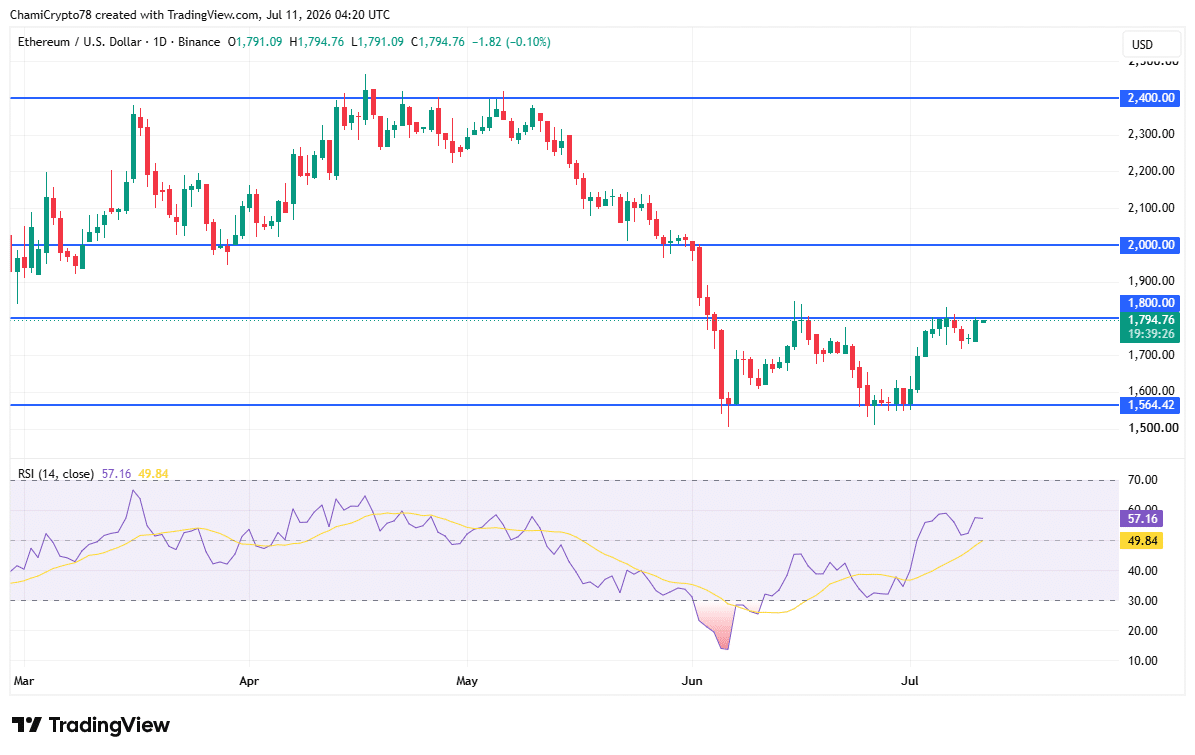
Ethereum [ETH] reclaimed the $1,800 region after recovering sharply from its early June low near $1,560.
Buyers repeatedly defended higher lows throughout July, allowing the price to consolidate just beneath the next resistance around $2,000.
The Relative Strength Index also recovered to 57.16, while its moving average stood at 49.84, confirming that buying strength improved after emerging from deeply oversold territory.
Even so, RSI remained below overbought conditions, leaving room for either continued stabilization or renewed consolidation.
Price also continued trading below the major $2,000 resistance that previously acted as support before June’s decline.
If buyers maintain control above $1,800, Ethereum would continue preserving its improving technical structure.
However, failure to defend that level would likely return focus to the lower support around $1,564, where buyers previously regained control.
What does it all mean?
To sum up, Ethereum presented conflicting signals rather than a one-sided narrative.
The historically low MVRV ratio strengthened the long-term valuation case, while rising Open Interest reflected sustained trader participation.
However, exchange inflows showed more ETH returned to trading venues instead of leaving them for long-term holding.
The combination suggests confidence improved, yet caution still shaped market positioning as investors balanced attractive valuation against lingering uncertainty.
Final Summary
- Ethereum looked historically undervalued, but Exchange Netflows suggested investors still preferred flexibility over long-term conviction.
- ETH’s setup improved, but holding above $1,800 could decide whether buyers keep control.