
Close Menu
  • Latest News
    • Market
    • Altcoins
    • Legal and Regulatory
  • Tech
    • Blockchain
    • Security and Privacy
  • Web 3
    • Web3 News
    • NFTs
    • Gaming
  • Learn
    • Education
    • Investments
    • Staking
    • Wallets and Exchanges
  • ICOs
  • Mining
  • Crypto Tools
    • Exchange Tool
  • Shop
What's Hot

LND Candidate Tests Bitcoin Fee-Estimate Guardrails

October 26, 2026

Fed, ECB and BOJ decisions, Coinbase earnings: Crypto Week Ahead

October 26, 2026

Tether is Developing AI-Powered Bitcoin Mining Management Technology! Here are the Details

October 26, 2026
Facebook X (Twitter) Instagram
  • Contact
  • Privacy Policy
  • Terms & Conditions
Facebook X (Twitter) Instagram
CryptoPulseDaily.com
  • Latest News
    • Market
    • Altcoins
    • Legal and Regulatory
  • Tech
    • Blockchain
    • Security and Privacy
  • Web 3
    • Web3 News
    • NFTs
    • Gaming
  • Learn
    • Education
    • Investments
    • Staking
    • Wallets and Exchanges
  • ICOs
  • Mining
  • Crypto Tools
    • Exchange Tool
  • Shop
CryptoPulseDaily.com
Home»Altcoins»XEC surges 13% on Consensus update – But 2 factors suggest a correction
Altcoins

XEC surges 13% on Consensus update – But 2 factors suggest a correction

October 26, 2026No Comments3 Mins Read
Share
Facebook Twitter LinkedIn Pinterest Email

eCash [XEC] saw a dominant surge in price, with a rally of 13% at press time. Several factors have influenced the gains. On the fundamental side, the payment network is making moves to update its consensus rules.

Other bullish indicators have emerged from the capital flowing into XEC more recently. However, there is still a major hurdle ahead that could limit the price rally. In fact, the chart data suggests that the asset may be overvalued.

XEC faces resistance despite bullish momentum

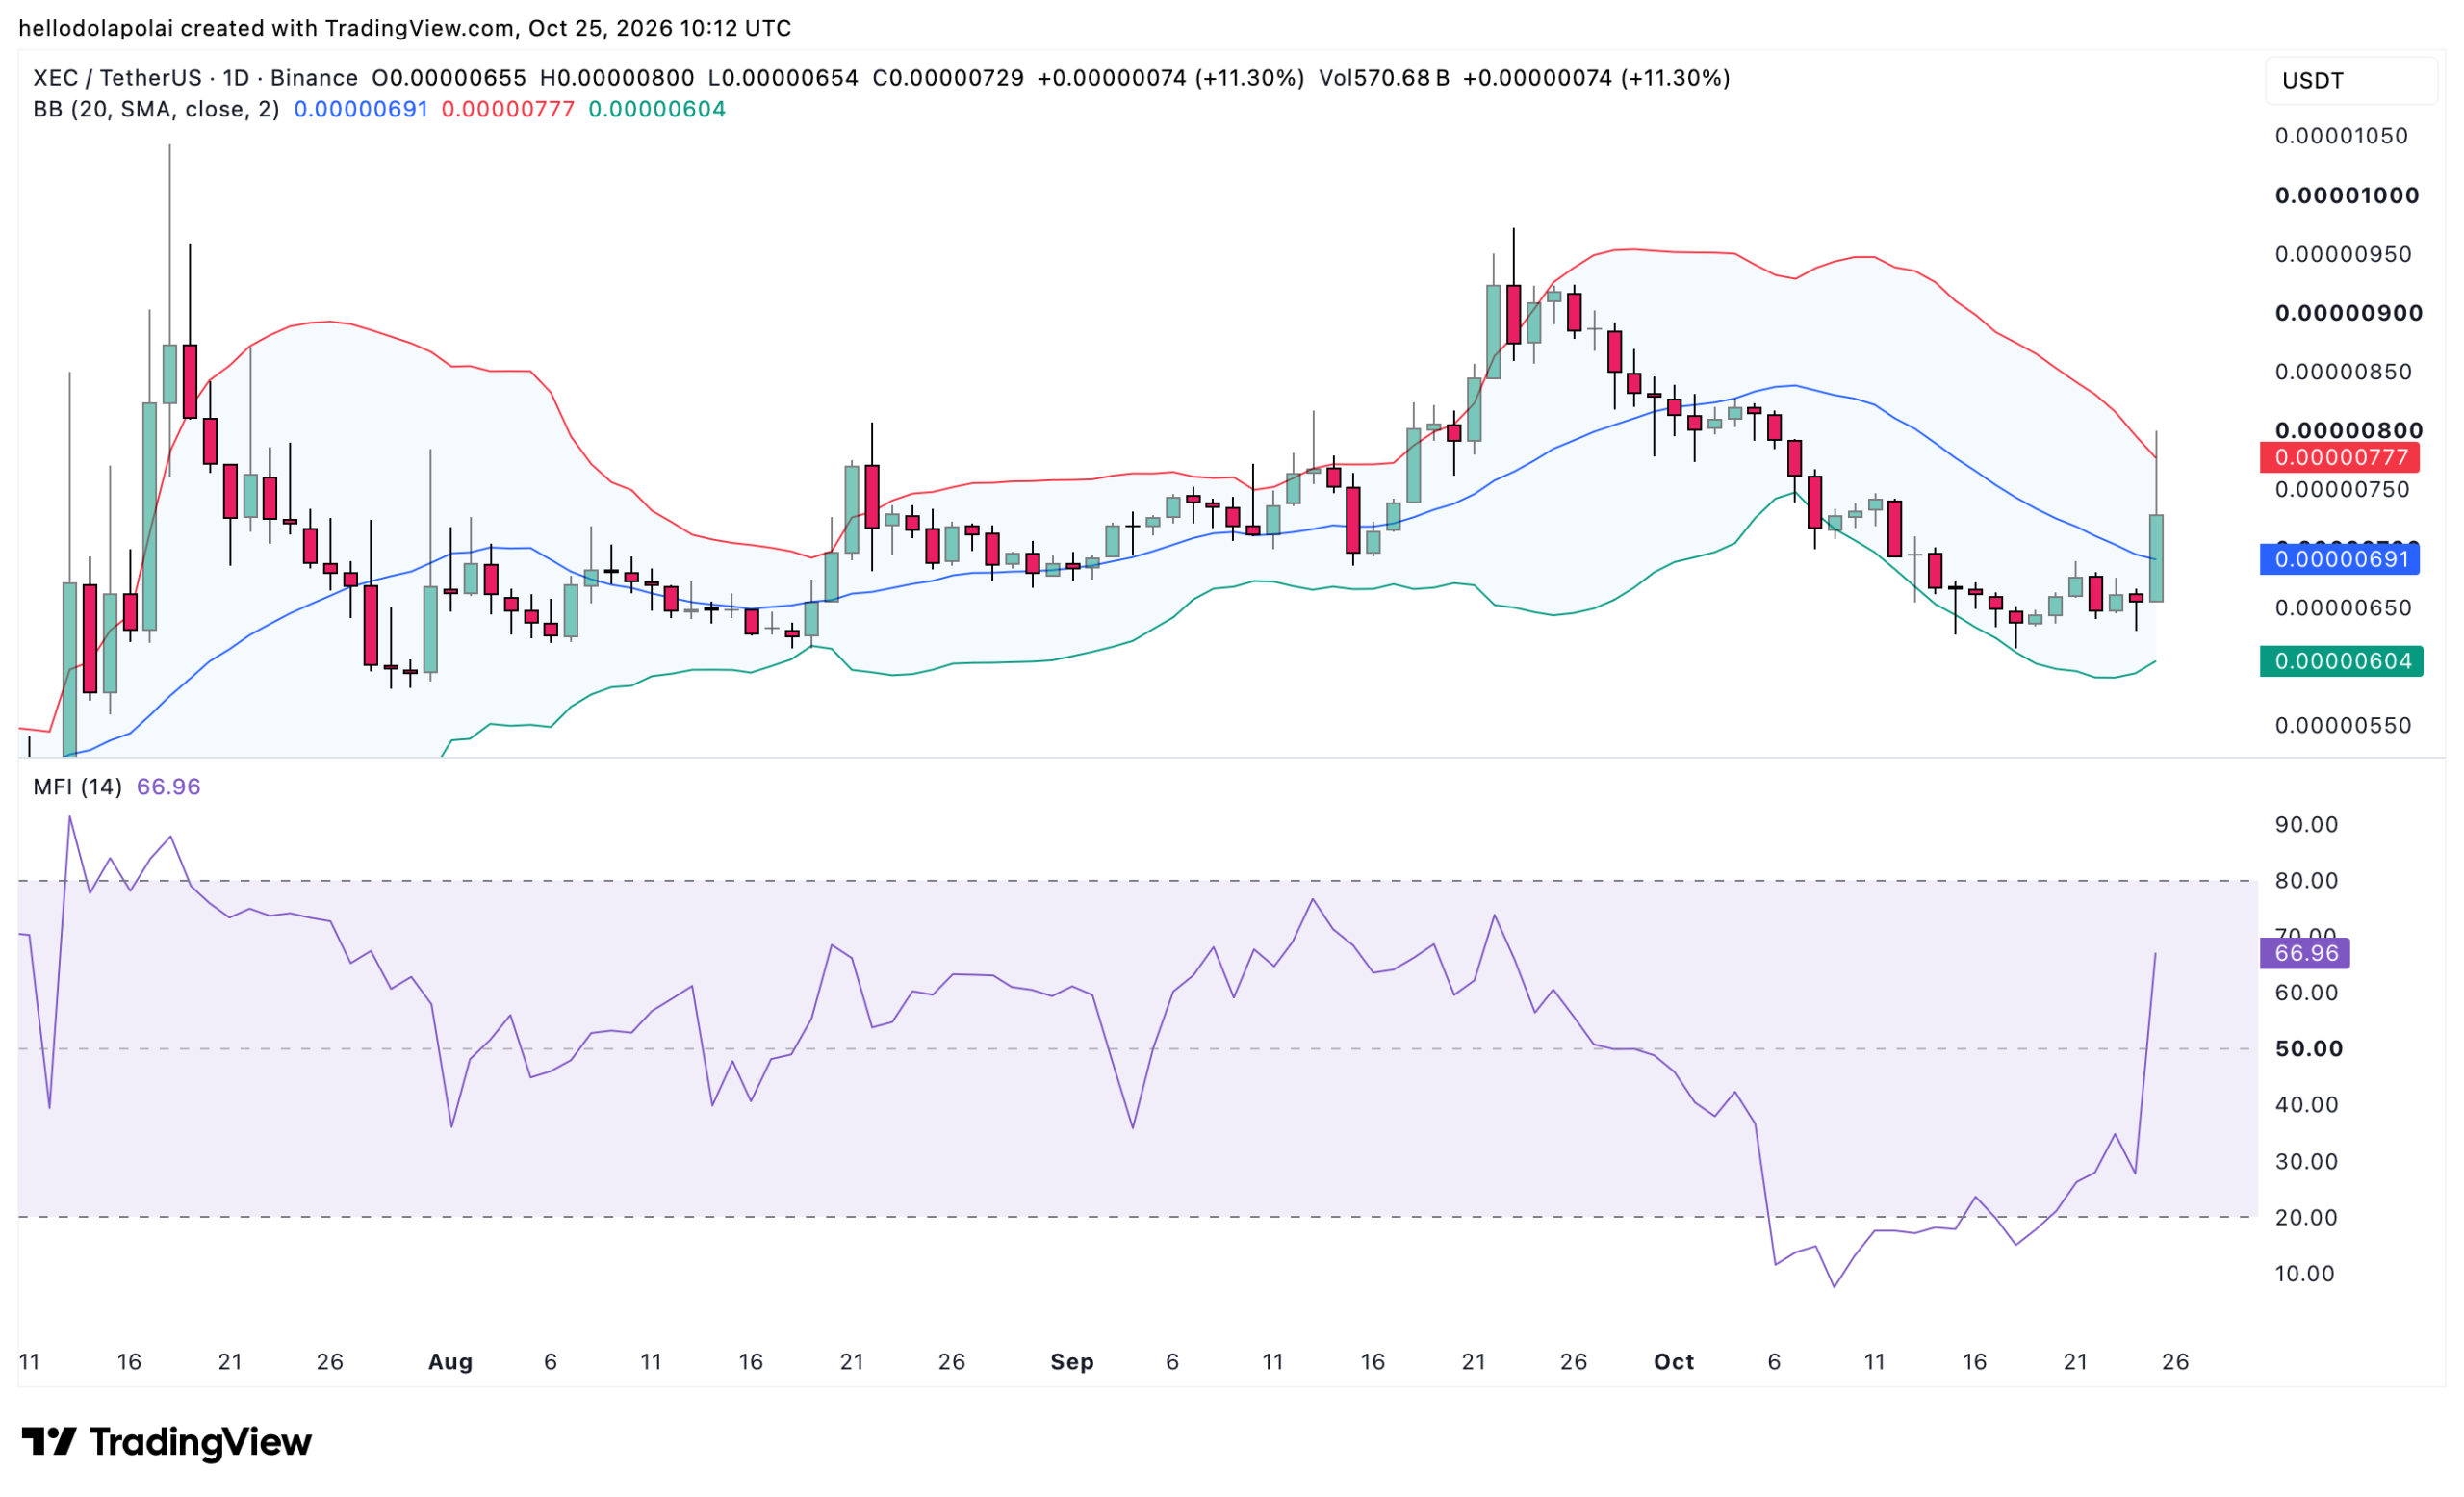
Analysis of XEC’s price action using the Bollinger Bands chart shows that the asset has traded into overvalued territory, based on the Bollinger Bands indicator.

The Bollinger Bands operate on three levels, the upper level (red band), the middle level, and the lower level (green band). The upper band indicates resistance when an asset becomes overvalued, while the lower band provides support when the asset becomes undervalued.

XEC traded into the upper zone in the early hours of October 25 and has since seen a minor pullback to the press-time level of $0.000073.
XEC price chart.XEC price chart.
Source: TradingView

Yet, there is still a tendency for the price to make further upward moves, potentially testing the upper band again. This outlook is based on the Money Flow Index (MFI) indicator.

The MFI tells traders when there is capital inflow or outflow from an asset. A reading between 50 and 80 suggests more inflow and indicates that traders are buying, while a reading between 20 and 50 suggests an outflow of capital from the market.

Presently, the MFI has a reading of 66.96 on the chart, implying that more capital is still flowing into XEC, which could add to the existing momentum.

See also  TRON network adoption surges to all-time highs: Can TRX beat the 60% bearish positioning?

Spot buying supports XEC’s rally

The capital inflow that has benefited the XEC rally did not begin this way. The early hours of trading suggests that there was more selling in the market than buying.

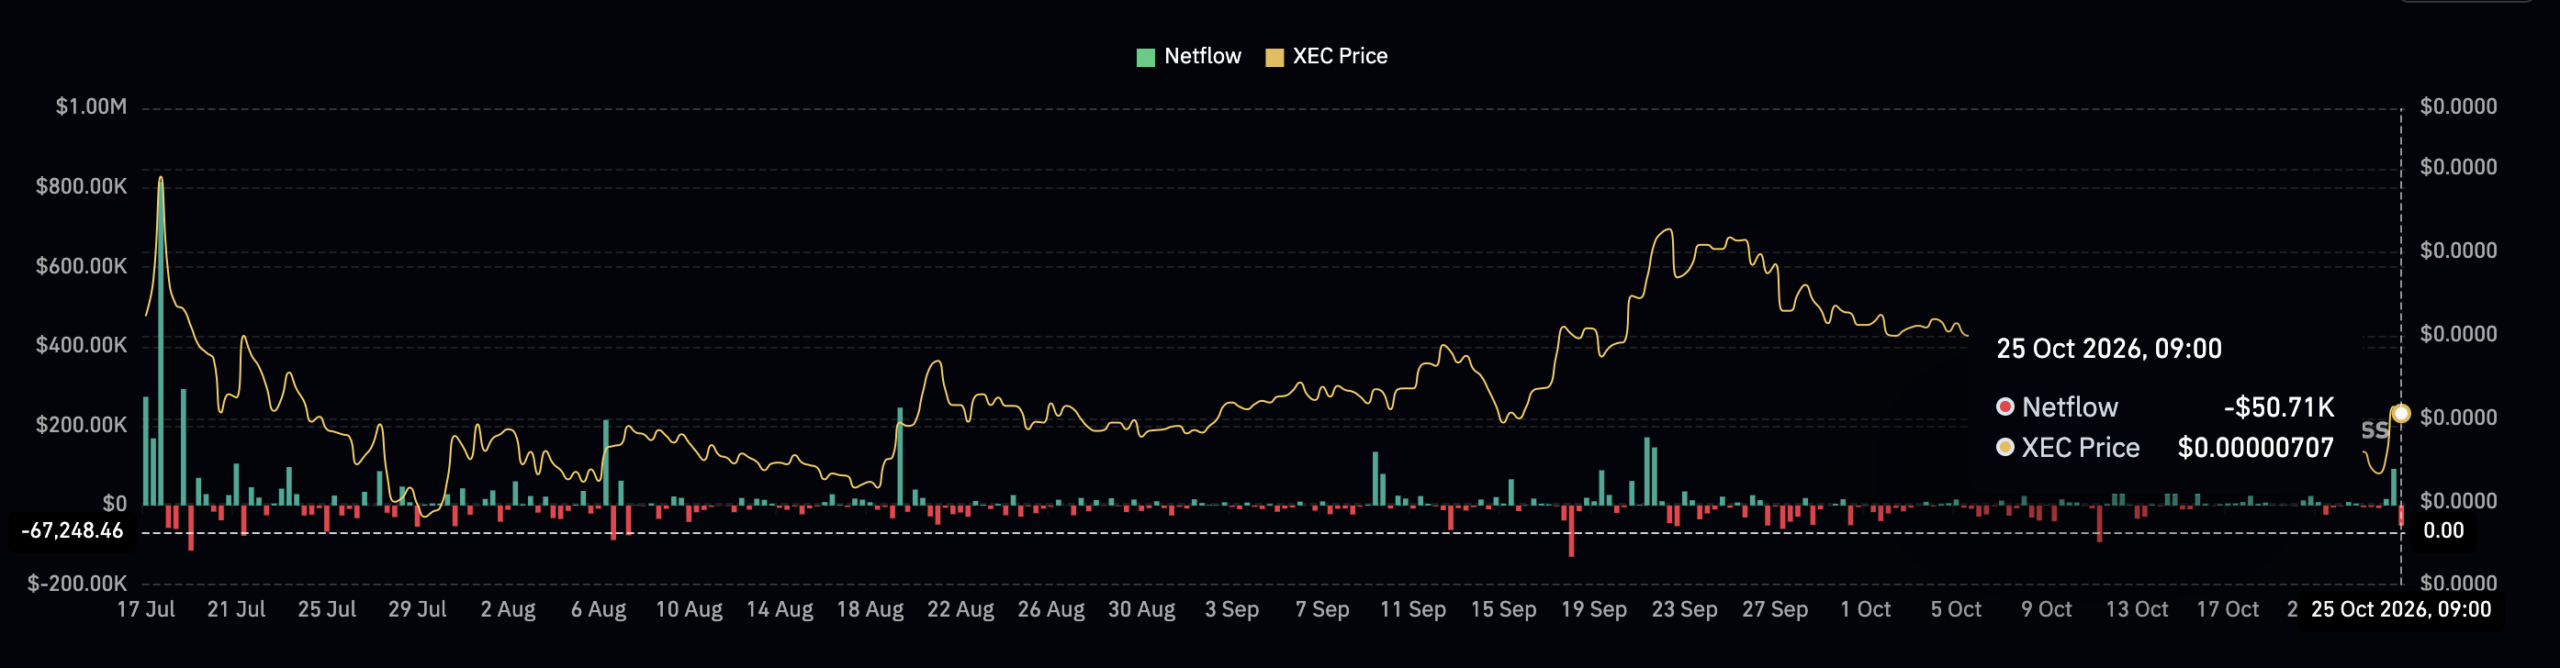
Data from CoinGlass shows that while XEC saw a surge in the early hours of the day, traders in the market sold a significant portion of it, with roughly $92,000 sold.
XEC spot netflowXEC spot netflow
Source: CoinGlass

In the past eight hours until press time, however, the Spot Netflow has since turned negative, with a reading of -$50,000 at the time of the analysis. When there is a shift from bearish to bullish conditions, it often implies growing interest among traders in holding the asset for longer.

Notably, over the past 24 hours, there has been more selling than buying, with a Netflow of $85.

Given the more recent buying activity over the past 8 hours, there is a high chance that the asset will see further growth in bullish buying activity in the market.

Negative Funding Rate raises downside risks

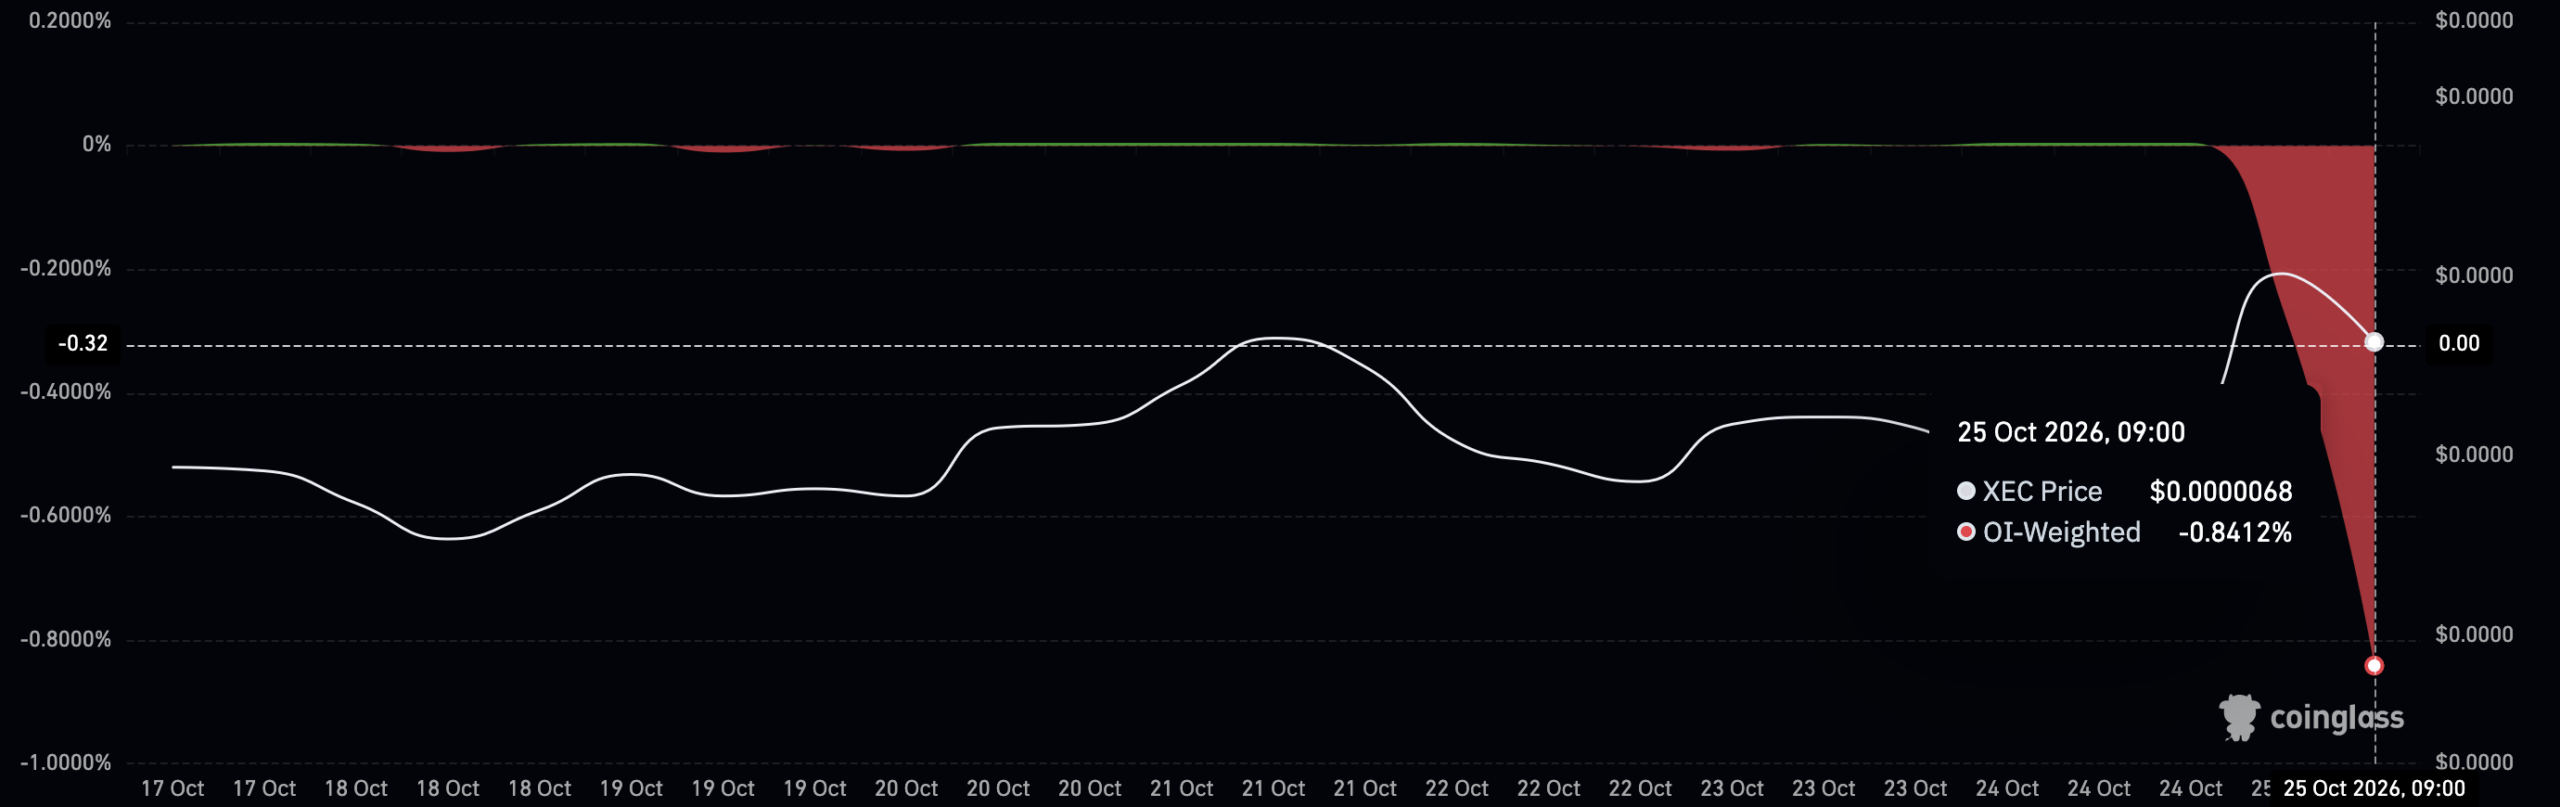
Funding Rate data shows a growing warning of a potential price decline as the rate becomes extremely negative.

According to CoinGlass data, the Funding Rate has plummeted to -0.7289%, indicating that most traders are holding short positions.
XEC funding rate.XEC funding rate.
Source: CoinGlass

The growth in aggressive shorting implies that there is a high chance the price will decline in the near term, potentially liquidating over-exposed buy positions in the market.


Final Summary

  • XEC rallied 13% as the Money Flow Index reached 74.5, indicating continued capital inflows despite overbought conditions.
  • The Funding Rate fell to -0.7289%, raising the risk of a price decline as short positions increased.

Source link

See also  Shibarium nears new milestone as SHIB faces a decline
Consensus Correction Factors Suggest Surges Update XEC
Share. Facebook Twitter Pinterest LinkedIn Tumblr Email

Related Posts

LND Candidate Tests Bitcoin Fee-Estimate Guardrails

October 26, 2026

Bitcoin: Analyst sees ‘buying opportunity of a lifetime’ in BTC’s quantum crisis

October 26, 2026

A16z Frontier Expands The Crypto Investment Mandate

October 26, 2026

Crypto market’s weekly winners and losers – M, YELLOW, BTW, UMXM

October 25, 2026
Add A Comment
Leave A Reply Cancel Reply

Top Posts

Top Projects from Unstoppable Domains and AWS Hackathon

August 6, 2024

My Neighbor Alice Rolls Out Chapter One: A New Adventure, Powered by Chromia

July 25, 2025

DEEP Robotics Unveils Five Research Advances in Embodied AI

October 24, 2026

Subscribe to Updates

Get the latest creative news From Crypto Daily Pulse directly in your Inbox!

Our mission is to develop a community of people who try to make financially sound decisions. The website strives to educate individuals in making wise choices about Crypto, ICOs, Web3, Blockchain and more.

We're social. Connect with us:

Facebook X (Twitter) Instagram Pinterest YouTube
Top Insights

LND Candidate Tests Bitcoin Fee-Estimate Guardrails

October 26, 2026

Fed, ECB and BOJ decisions, Coinbase earnings: Crypto Week Ahead

October 26, 2026

Tether is Developing AI-Powered Bitcoin Mining Management Technology! Here are the Details

October 26, 2026
Get Informed

Subscribe to Updates

Get the latest creative news From Crypto Daily Pulse directly in your Inbox!

  • Contact
  • Privacy Policy
  • Terms & Conditions
© 2026 Crypto Pulse Daily - All rights reserved.

Type above and press Enter to search. Press Esc to cancel.

Cleantalk Pixel
  • bitcoinBitcoin(BTC)$80,338.000.20%
  • ethereumEthereum(ETH)$2,328.070.25%
  • tetherTether(USDT)$1.000.01%
  • binancecoinBNB(BNB)$739.000.32%
  • rippleXRP(XRP)$1.29-0.16%
  • usd-coinUSDC(USDC)$1.000.01%
  • solanaSolana(SOL)$101.430.83%
  • tronTRON(TRX)$0.3307190.59%
  • Figure HelocFigure Heloc(FIGR_HELOC)$1.060.00%
  • zcashZcash(ZEC)$1,231.833.92%