
Render [RENDER] was among the top gainers for the day in the crypto market. The native token of the decentralized GPU-based rendering solution provider network has rallied 4% for the day, comfortably surpassing the gains of the leaders, Bitcoin [BTC] and Ethereum [ETH], at 0.06% and 0.49%, respectively, at the time of writing.
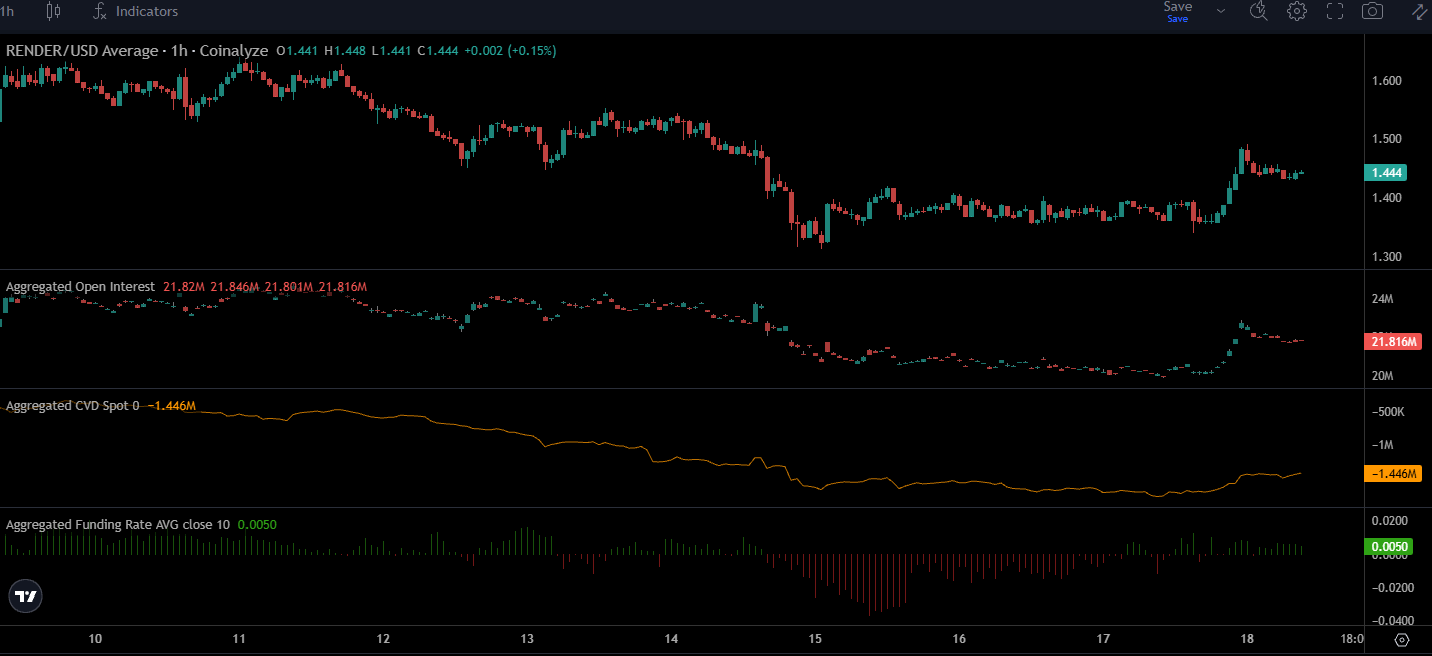
Alongside its price move, the Open Interest was up by 9.15% for the day. A high OI uptick alongside a price bounce generally points to speculative buying and short-term bullish belief.
The spot CVD was also slowly climbing higher, while the funding rates remained close to zero, according to Coinalyze data. This meant that spot buying was beginning to recover, and the threat of a long squeeze on the back of the swift OI uptick was minimal.
In other news, Render participated in Solana’s Breakpoint 2026, showcasing its immersive digital art exhibition.
RENDER long-term consolidation not yet shaken off
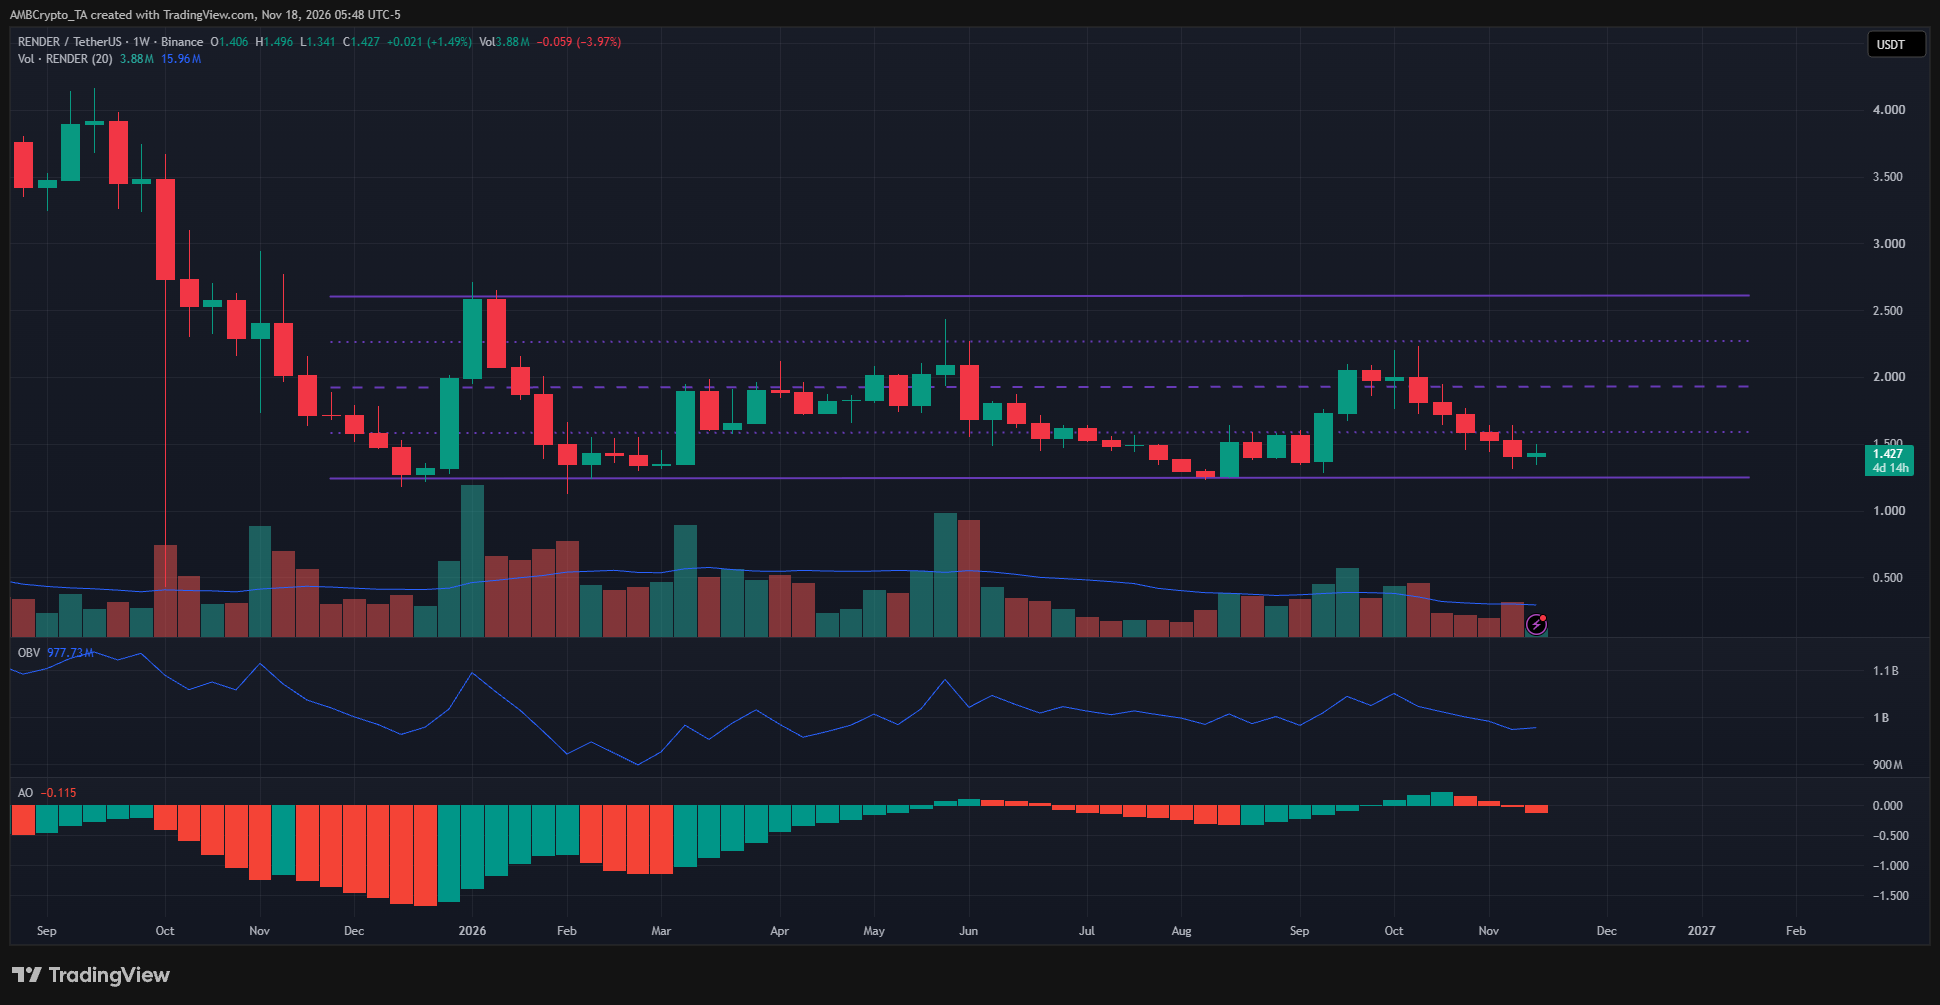
Since December 2025, RENDER bulls have stubbornly defended the $1.24 support zone. Marked as the lows of a long-term range, the weekly chart above highlighted the lack of a decisive trend.
The OBV has been moving sideways since May and has not managed to set notable new highs or lows. The Awesome Oscillator also meandered about the zero line, unlike October-November of 2025 when bearish momentum was dominant.
The $1.24 support, range high of $2.60, and the mid-range level at $1.92 (close to the $2.0 supply zone) were worth investor scrutiny for price trend clues.
Retest of former local floor colors short-term RENDER outlook
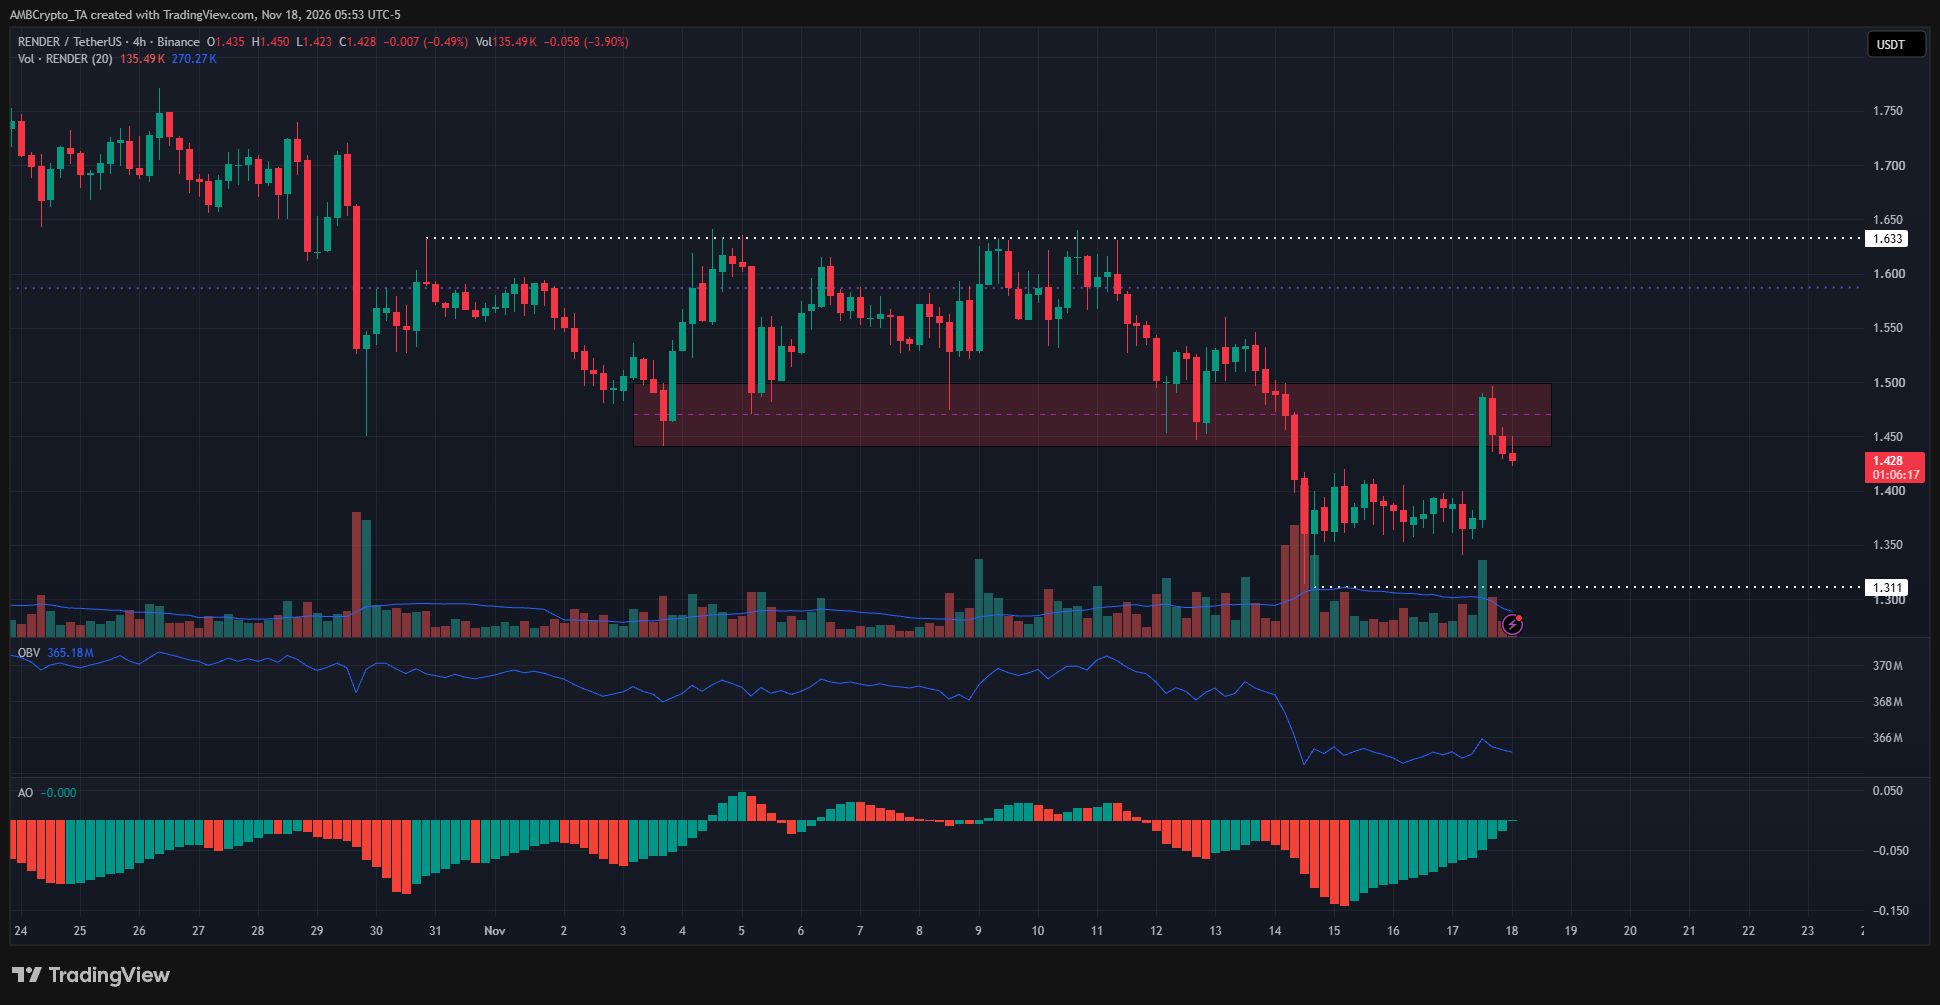
The 4-hour chart was more encouraging for traders as there was a noticeable price trend. The OBV had slipped considerably earlier this month, a result of the market-wide sell-off towards the end of the previous week.
The $1.45-$1.50 former support zone has now been retested as a supply zone. It is likely that RENDER would continue its H4 downtrend and seek the $1.31 lows next.
Final Summary
- The Render short-term speculative belief appeared to be bullish following Tuesday’s 11.56% price rally.
- The 4-hour chart highlighted why bears were likely in control of the market, while the weekly chart illuminated a long-term range formation.


