
The US Dollar Index (DXY) has reached its highest level in almost a year. Contrary to the widely held bearish view of the dollar, this marks a strong shift, which is now entering a phase of potential consolidation.
If the US Dollar confirms the start of a new uptrend, this could have major implications for broad financial markets and cryptocurrencies. However, despite the historical negative correlation between DXY and BTC, this impact does not necessarily lead to declines in the crypto sector.
US Dollar Reaches New One-Year Peak
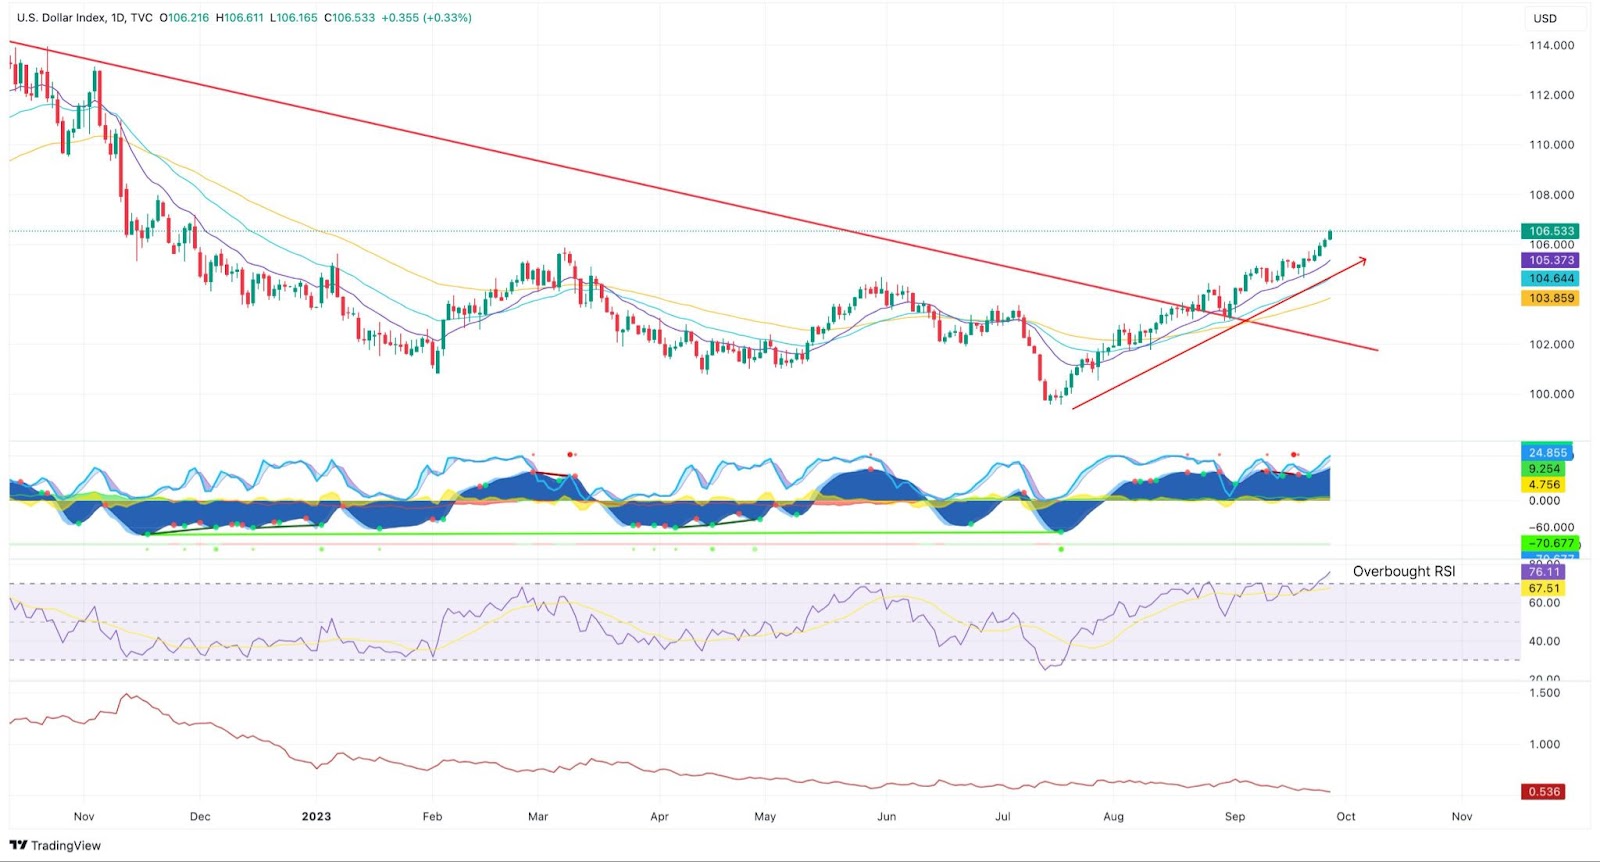
The US Dollar index peaked at 114.8 in September 2022. A month and a half later, it broke down from the parabolic support line (blue) and began a downtrend. This one ended at 99.5 in July 2023.
However, already in August, the DXY broke out above the descending downtrend line (black), initiating a medium-term uptrend. It led to a new one-year peak at 106.5 and the first higher high in almost a year.
Moreover, the US Dollar closed several daily candles above the key resistance at 105.5. Now, validating this resistance as support will be important for continuing the uptrend.
However, in case of a deeper correction, the 104 area at the 0.382 Fib retracement level should provide support. It remains in confluence with the previous swing high of May 2023.
If the DXY continues its upward movement, the next resistance is the 108.5 level at the long-term 0.236 Fib retracement. This area was lost during last year’s breakdown from a parabolic uptrend and the start of a downtrend.
Analyst: DXY Needs to Cool Down
Well-known cryptocurrency analyst @Negentropic_ also looked at the US Dollar chart and stated that “the DXY needs to cool down.” He pointed out the breakout above the falling resistance line, which runs slightly differently on his chart.
Moreover, he stressed that the Relative Strength Index (RSI) is already in overbought territory.
RSI is a momentum indicator traders use to assess whether the market is overbought or oversold. In addition, it helps them determine whether to accumulate or sell assets.
Readings above 50 and an uptrend suggest that the bulls still have an advantage. In contrast, readings below 50 indicate the opposite.
The RSI for the US dollar index recently exceeded the 70 level, which shows that the asset is overheated. Therefore, a correction is expected before the increase continues. Its trajectory will determine whether the US dollar will continue its uptrend.
Interestingly, the analyst is positive about the increase in the US dollar index regarding the potential benefits for the cryptocurrency market and Bitcoin.
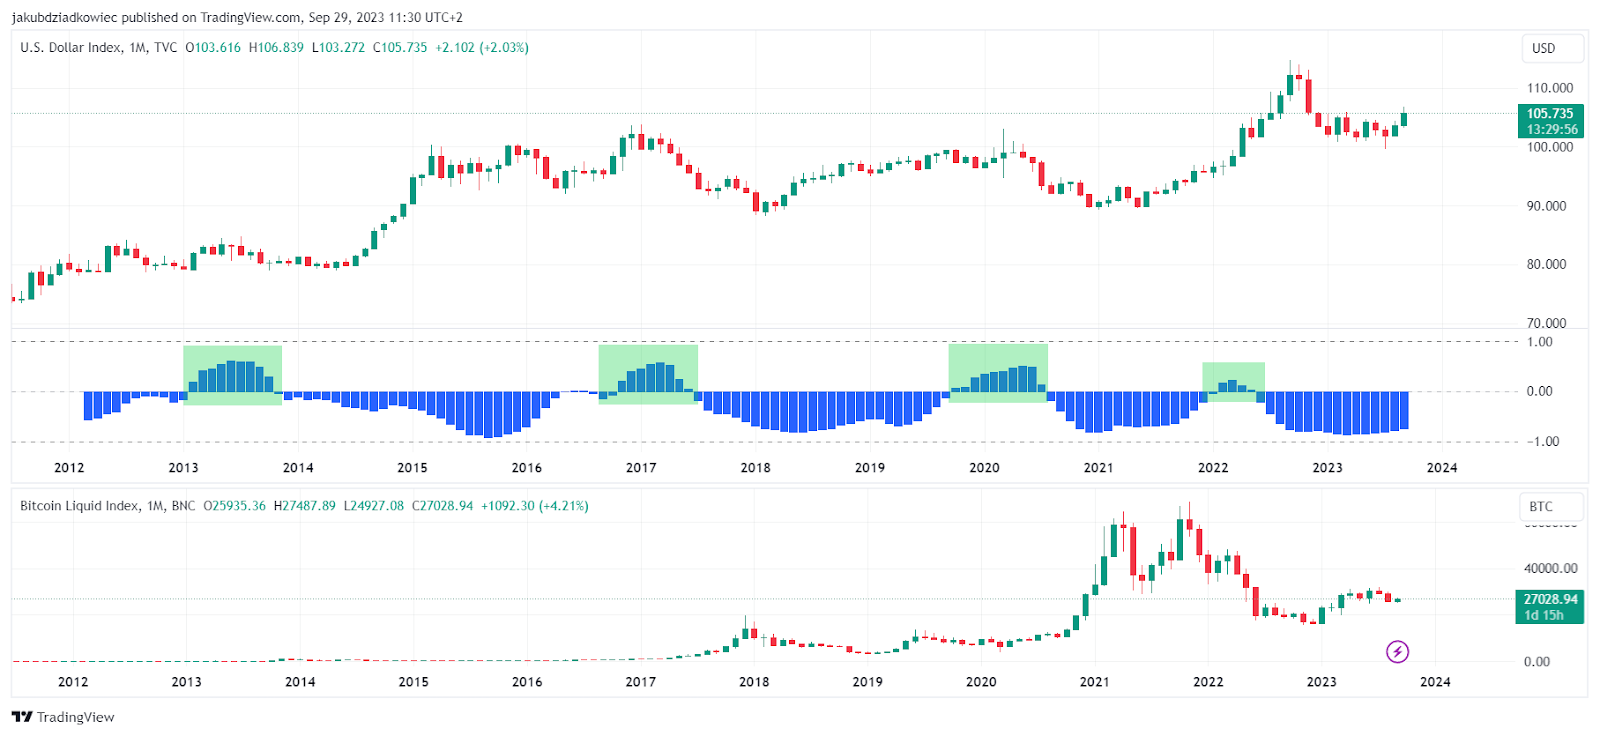
The long-term chart clearly shows a negative correlation between the DXY and BTC.
However, without a clear upward or downward trend during transitional periods, this correlation often disappears or even becomes positive (green areas). Therefore, @Negentropic_ does not hesitate to write:
“Greater market liquidity tends to benefit BTC in the long term, as investors seek alternative assets to hedge against sluggish economic growth.”
Saylor: Bitcoin is a lifeline
Meanwhile, famous investor and Bitcoin maximalist Michael Saylor has published a chart on X that pits the US dollar against other currencies.
The data shows that virtually all local currencies have been losing against the US Dollar over the past 10 years.
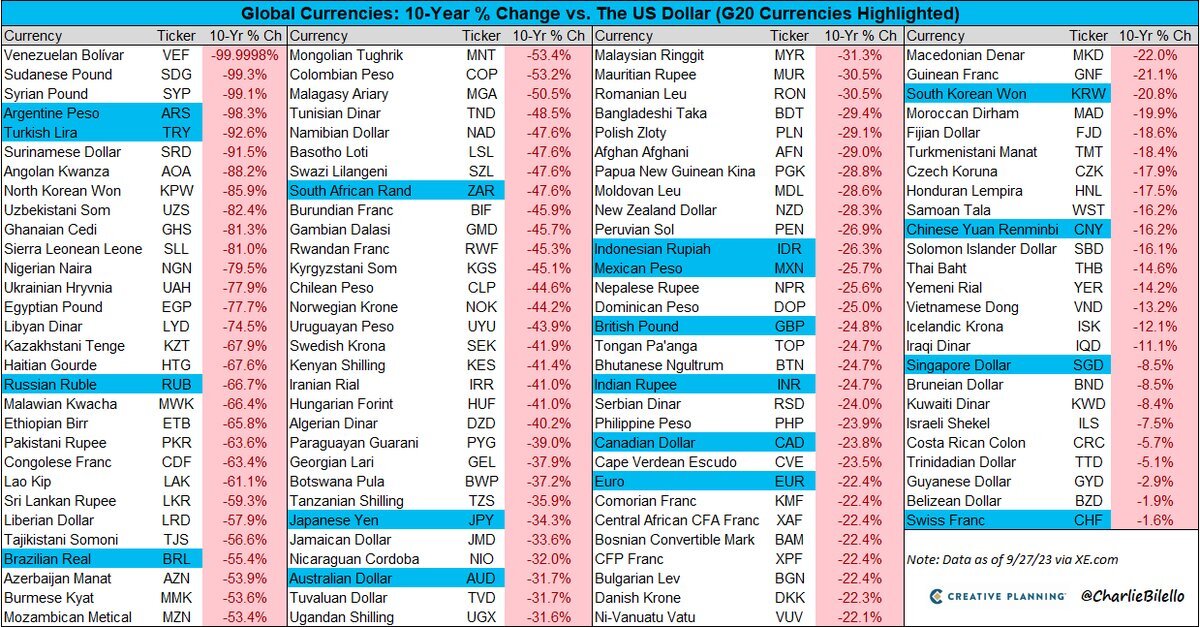
Despite this, Saylor still maintains his maximalist stance and bets on BTC. His conclusion is encapsulated in a short piece of advice:
“If you don’t have access to dollars, #bitcoin is a lifeline.”
So, according to the above data, the dollar seems to be a hedge against the weakening value of local currencies. However, if the above long-term negative correlation between the DXY and BTC is maintained, Bitcoin may prove to be a hedge against the dollar.
For BeInCrypto’s latest crypto market analysis, click here.
Disclaimer
In line with the Trust Project guidelines, this price analysis article is for informational purposes only and should not be considered financial or investment advice. BeInCrypto is committed to accurate, unbiased reporting, but market conditions are subject to change without notice. Always conduct your own research and consult with a professional before making any financial decisions.


