
In this comprehensive analysis, we delve into Polkadot’s recent price surge, driven by both technical and on-chain indicators
Penetrating the daily Ichimoku cloud could indicate continued price appreciation towards $8.
Polkadot Technical Outlook: Understanding the Surge
Polkadot (DOT) has broken above the 4-hour Ichimoku cloud. Returning to the cloud in the 4-hour timeframe could signal a trend reversal. On the daily timeframe, the price of Polkadot is approaching the lower boundary of the Ichimoku cloud.
Polkadot On-Chain Data: A Deep Dive
The chart illustrates that the number of new addresses on the Polkadot Relay Chain has experienced two consecutive monthly declines. This trend is a bearish indicator. Polkadot is currently struggling to attract new entrants to the network.
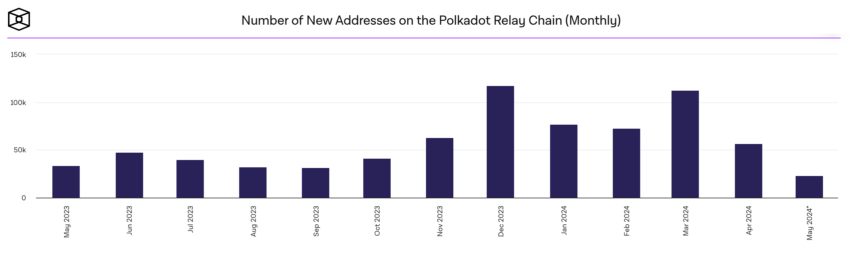
A sustained reduction in the number of new addresses can impact the overall health and expansion of the Polkadot ecosystem.
Read More: What Is Polkadot (DOT)?
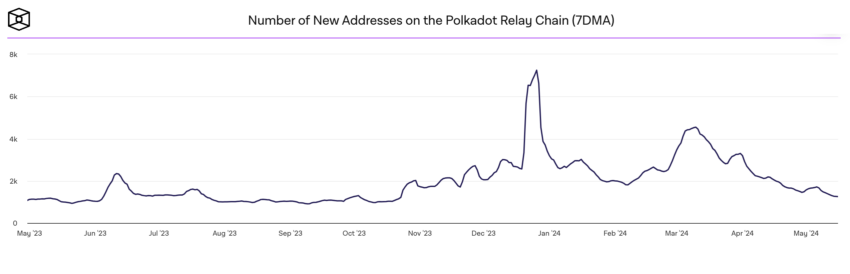
Active addresses are a key indicator of user engagement and network health. In the context of Polkadot, this decline could mean several things:
- First, it might indicate that existing users are less active, possibly due to a lack of compelling projects, updates, or incentives to maintain engagement.
- Second, it could reflect broader market trends affecting the entire cryptocurrency space, where users are becoming more cautious or shifting their focus to other platforms.
- Third, a decrease in active addresses on a blockchain focused on interoperability could imply challenges in maintaining its unique value proposition compared to other Layer 0 or Layer 1 solutions.
The chart below illustrates the 7-day moving average (7DMA) of daily transfers on the Polkadot Relay Chain. This highlights a significant downward trend. Following a peak in January 2024, where daily transfers nearly reached 40,000, the number of transfers has steadily declined.
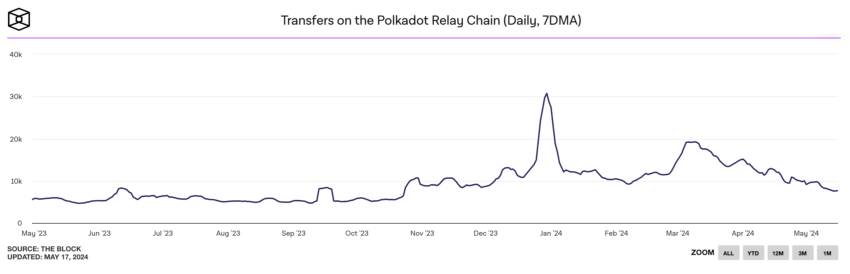
This decline in transfer volume can have several implications for Polkadot’s price. Reduced transfer activity often correlates with lower overall network usage and decreased demand for the native DOT token (in the mid-term).
Strategic Recommendations and Future Price Implications
Neutral Outlook
- Polkadot (DOT) has demonstrated an upward trend, breaking the 4-hour Ichimoku cloud to the upside. This technical pattern suggests potential bullish momentum. However, traders should be cautious as a pullback to the cloud in the 4-hour timeframe could signal a trend reversal.
- The recent upward trend in Polkadot’s price is heavily influenced by the broader market movements, notably the increase in Bitcoin’s price. Additionally, speculative activities around Polkadot’s derivatives contracts on centralized exchanges have contributed to the price surge.
- While the technical indicators point towards bullish momentum, the on-chain data highlights potential risks. The decrease in new and active addresses and reduced transfer volumes signal a decline in user engagement and network activity.
Read More: Polkadot (DOT) Price Prediction 2024/2025/2030
Entry Points and Risk Management
- Traders should consider entering long positions on Polkadot if it successfully penetrates the 4H Ichimoku cloud to the downside, targeting a move toward $8. However, monitoring Bitcoin’s price movements is crucial, as a test of the $61K level by Bitcoin could lead to a sharp correction in DOT’s price. Although the probability of such a correction has decreased, it remains a risk, particularly in the event of macroeconomic or geopolitical factors.
- In the mid to long term, traders should employ risk management strategies, including setting stop-loss orders below key support levels (6 – $6.4) to mitigate potential losses.
Disclaimer
In line with the Trust Project guidelines, this price analysis article is for informational purposes only and should not be considered financial or investment advice. BeInCrypto is committed to accurate, unbiased reporting, but market conditions are subject to change without notice. Always conduct your own research and consult with a professional before making any financial decisions. Please note that our Terms and Conditions, Privacy Policy, and Disclaimers have been updated.

