Close Menu
  • Latest News
    • Market
    • Altcoins
    • Legal and Regulatory
  • Tech
    • Blockchain
    • Security and Privacy
  • Web 3
    • Web3 News
    • NFTs
    • Gaming
  • Learn
    • Education
    • Investments
    • Staking
    • Wallets and Exchanges
  • ICOs
  • Mining
  • Crypto Tools
    • Exchange Tool
  • Shop
What's Hot

39M WLFI treasury alert – Can World Liberty buyers absorb $2.19M?

August 15, 2026

the prediction market emergency that could redraw federal-state crypto boundaries

August 15, 2026

CLARITY Act odds fall to10%

August 15, 2026
Facebook X (Twitter) Instagram
  • Contact
  • Privacy Policy
  • Terms & Conditions
Facebook X (Twitter) Instagram
CryptoPulseDaily.com
  • Latest News
    • Market
    • Altcoins
    • Legal and Regulatory
  • Tech
    • Blockchain
    • Security and Privacy
  • Web 3
    • Web3 News
    • NFTs
    • Gaming
  • Learn
    • Education
    • Investments
    • Staking
    • Wallets and Exchanges
  • ICOs
  • Mining
  • Crypto Tools
    • Exchange Tool
  • Shop
CryptoPulseDaily.com
Home»Market»Can Polygon (MATIC) Price Breakout and Reach $1?
Market

Can Polygon (MATIC) Price Breakout and Reach $1?

December 7, 2023No Comments3 Mins Read
Share
Facebook Twitter LinkedIn Pinterest Email

The Polygon (MATIC) price has fallen since reaching a high of $0.98 on November 14. 

Despite the decrease, the MATIC price regained its footing in December and is making a breakout attempt. Will it be successful?

MATIC Gets Rejected From Long-Term Resistance

On a weekly timeframe, MATIC’s technical analysis reveals a downtrend since its peak in December 2021, marked by a descending resistance trend line in place for 707 days.

The most recent rejection (red icon) occurred three weeks ago. This took MATIC to a crucial horizontal zone, which has alternated between support and resistance since April 2022.

MATIC/USDT Weekly Chart. Source: TradingView

Traders commonly utilize the Relative Strength Index (RSI) as a momentum indicator to discern overbought or oversold conditions and make decisions on asset accumulation or selling.

An RSI above 50 in an upward trajectory signifies a prevailing advantage for bulls, while values below 50 suggest the opposite.

The weekly RSI is on the rise and positioned above 50, signaling both upward momentum and a bullish trend.

It is also worth mentioning that Robinhood launched crypto trading in Europe, and Polygon is listed among the 26 cryptocurrencies available for trade.

What Are Analysts Saying?

Cryptocurrency traders and analysts on X give conflicting views on the future trend.

CryptoPoseidon is bearish since the price trades at resistance. He posted a potential short setup for the future MATIC price.
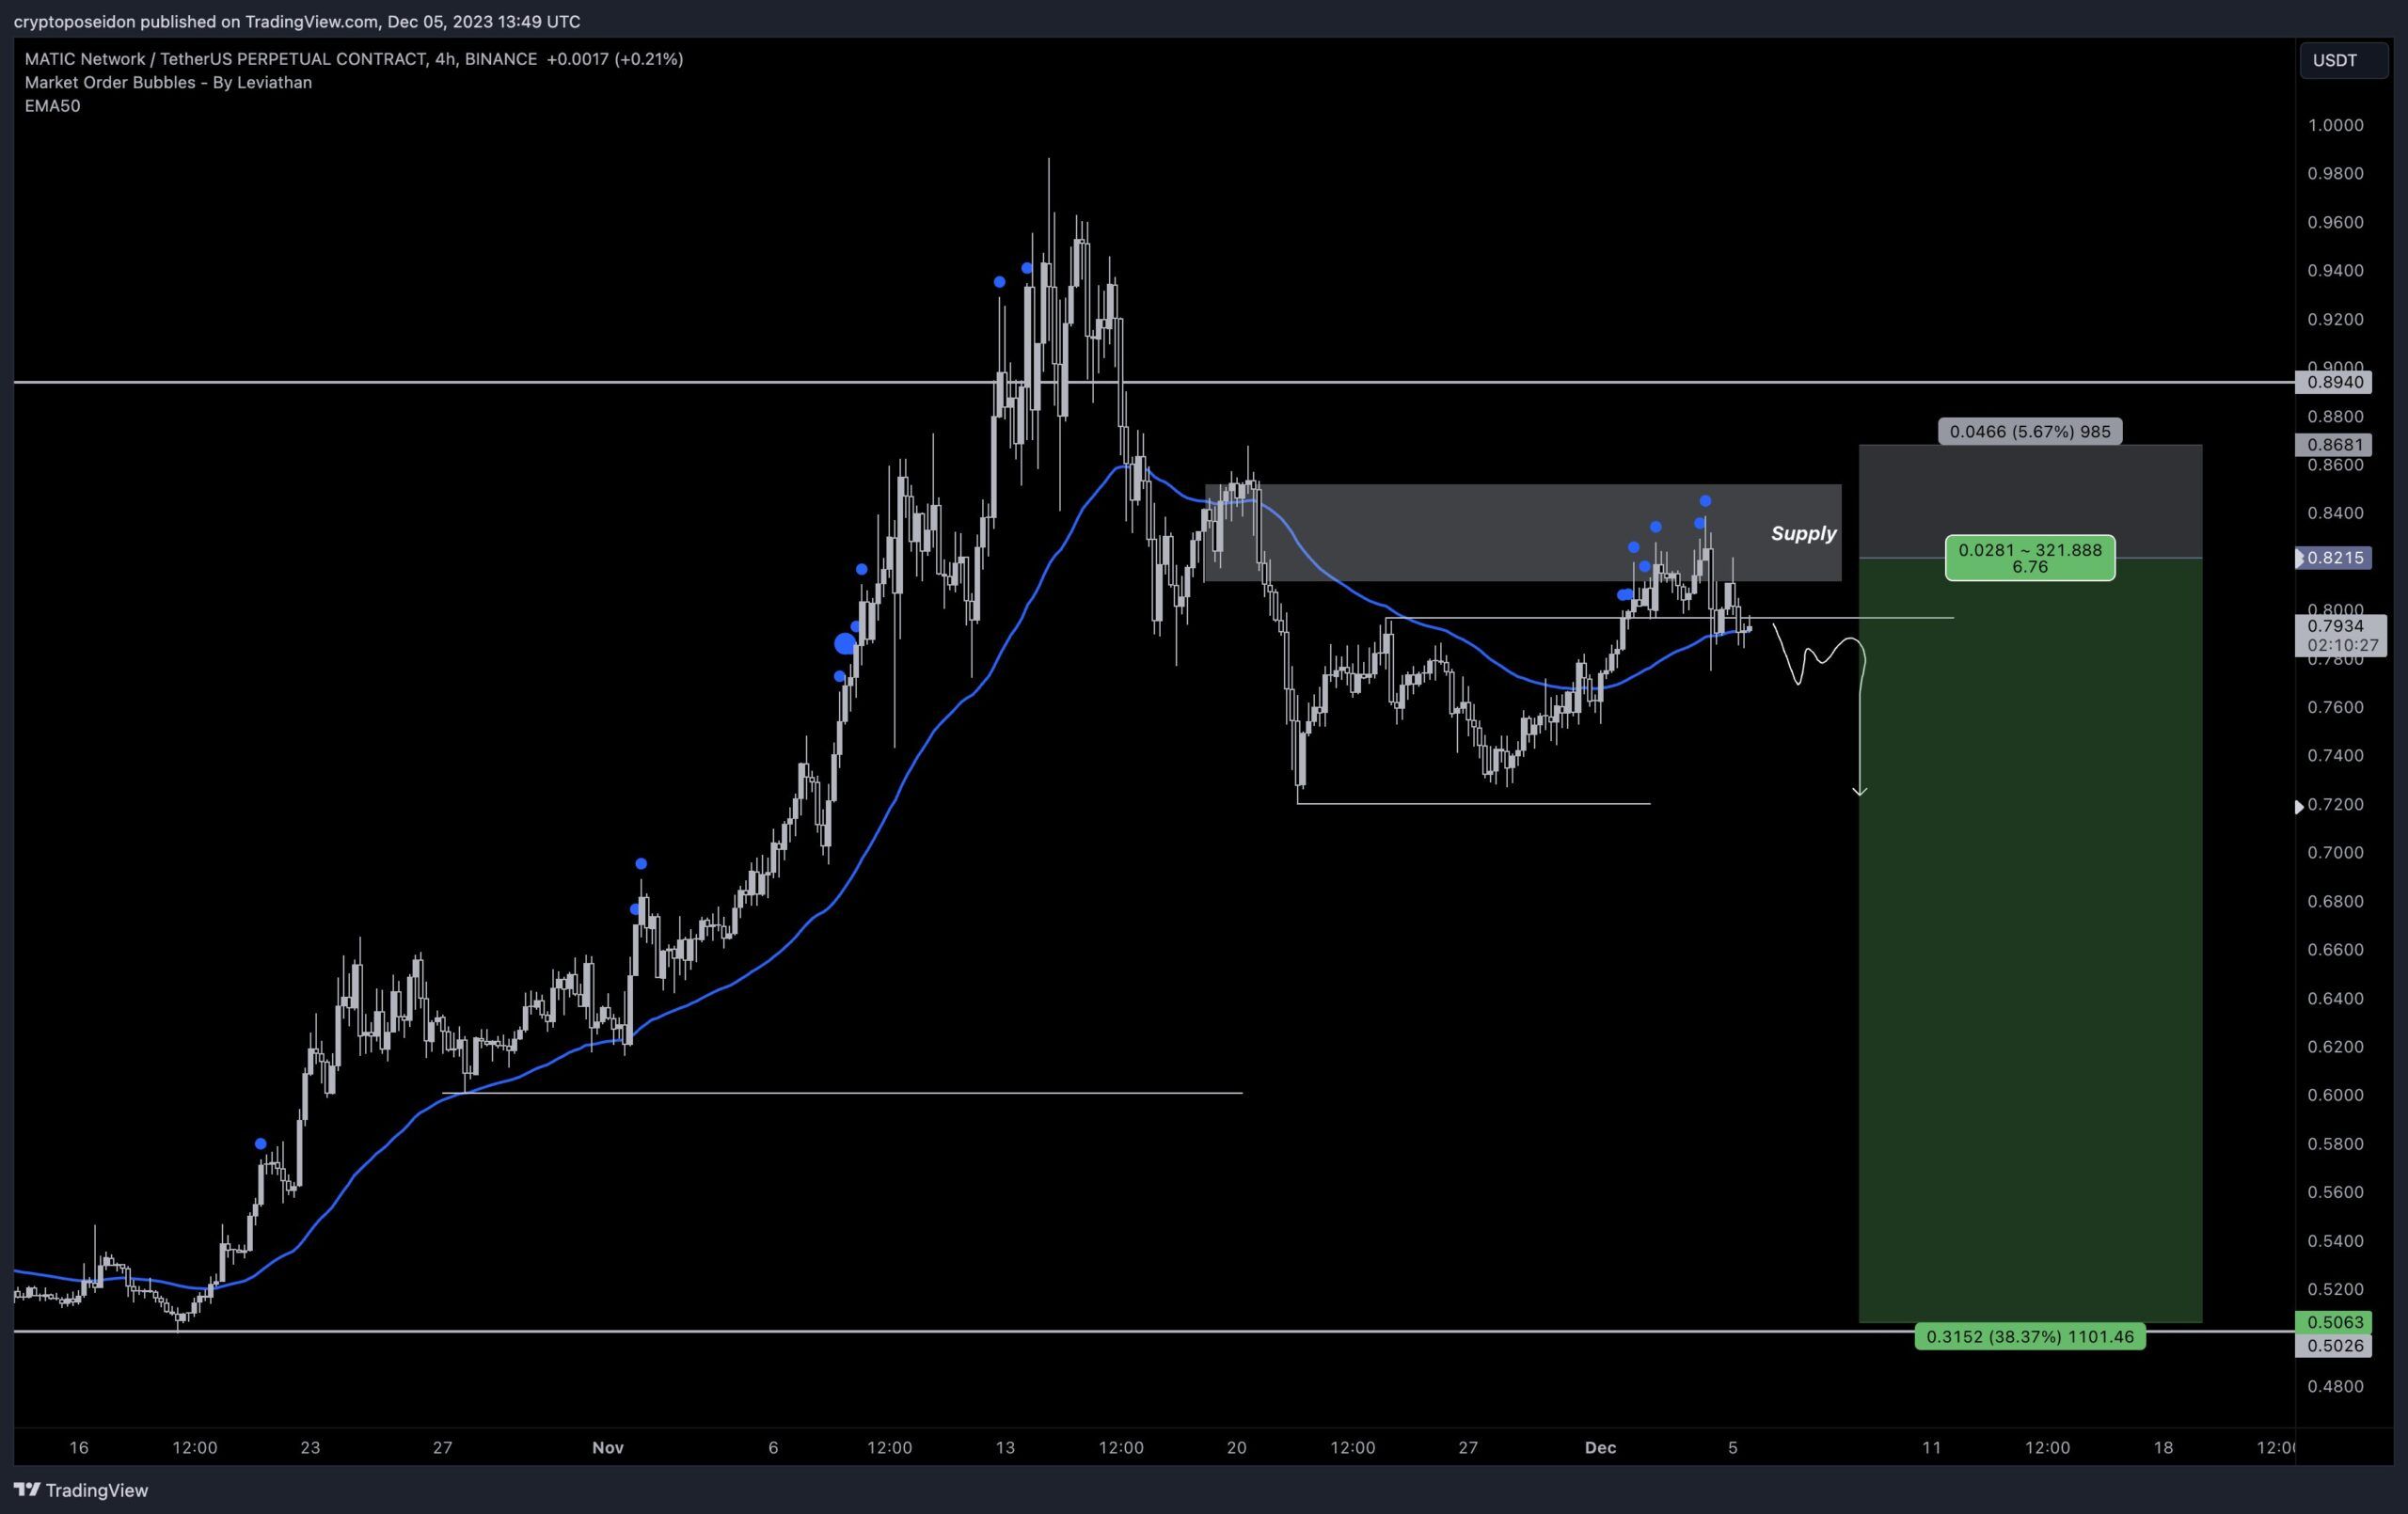
Polygon (MATIC) Price Short
MATIC/USDT Daily Chart. Source: X

MoreCryptoOnline is bullish, but he has doubts about whether the short-term correction is complete. He tweeted that:

“We still need to see 5 waves off the September lows to confirm that the price is in a bull market. At the moment we are watching if 5 waves to the upside can form, and one wave is still outstanding. In the preferred scenario wave 4 is unfolding right now and $0.64 is support. It is possible that wave 4 is already complete but we need to see more price data to confirm this.”

MATIC Price Prediction: Breakout or Breakdown? 

While the daily time frame also gives some conflicting signs, it is still leaning bullish. This is because of the price action and RSI. 

See also  Elon Musk's SpaceX (SPCX) tops earnings as bitcoin (BTC) holding value drops by $540 million

The price action shows that MATIC broke out from a descending resistance trend line on October 22, leading to a high of $0.98 on November 14.

However, the price could not sustain the increase and fell below the $0.85 area shortly afterward, suggesting that the previous increase was a deviation (red circle). 

Nevertheless, the MATIC price regained its footing and is attempting to break out from the $0.85 resistance area again. This attempt is supported by the daily RSI, which bounced at 50 (green icon) and is increasing. 

If MATIC breaks out above $0.85, it can increase by 45% and reach the next resistance at $1.25. 
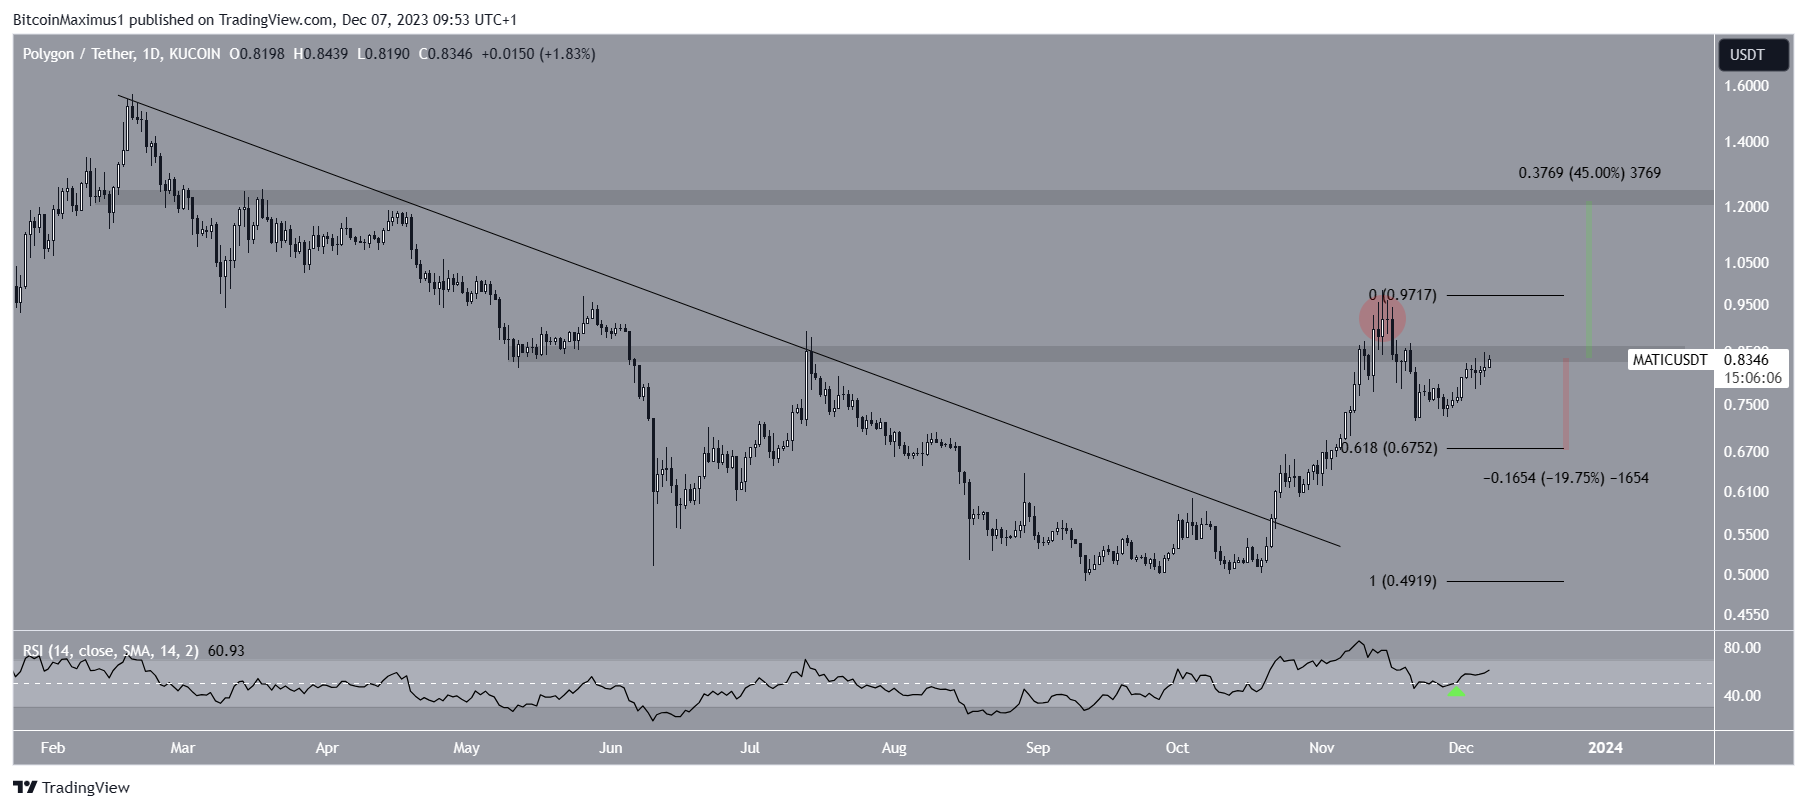
Polygon (MATIC) Price Movement
MATIC/USDT Daily Chart. Source: TradingView

Despite this bullish MATIC price prediction, a rejection from the $0.85 area can lead to a 20% decrease to the 0.618 Fib retracement support level at $0.67.

For BeInCrypto’s latest crypto market analysis, click here.

Disclaimer

In line with the Trust Project guidelines, this price analysis article is for informational purposes only and should not be considered financial or investment advice. BeInCrypto is committed to accurate, unbiased reporting, but market conditions are subject to change without notice. Always conduct your own research and consult with a professional before making any financial decisions.


Source link

breakout MATIC Polygon Price Reach
Share. Facebook Twitter Pinterest LinkedIn Tumblr Email

Related Posts

crypto derivatives traders on Hyperliquid price 4x upside on debut

August 15, 2026

Crypto’s week in 5 stories

August 15, 2026

Trump-backed World Liberty wins conditional bank charter from federal regulator

August 15, 2026

Trump expected to attend White House meeting with crypto CEOs, sources say

August 15, 2026
Add A Comment
Leave A Reply Cancel Reply

Top Posts

DCG, Genesis Were the ‘Adults in the Room’ but Didn’t Behave Like It

October 21, 2023

COPA v. Craig Wright nears final ruling on Bitcoin’s whitepaper

March 6, 2024

$WRX Pumps 66%, WazirX Customers Call “Nischal Shetty” A Superhero

December 14, 2024

Subscribe to Updates

Get the latest creative news From Crypto Daily Pulse directly in your Inbox!

Our mission is to develop a community of people who try to make financially sound decisions. The website strives to educate individuals in making wise choices about Crypto, ICOs, Web3, Blockchain and more.

We're social. Connect with us:

Facebook X (Twitter) Instagram Pinterest YouTube
Top Insights

39M WLFI treasury alert – Can World Liberty buyers absorb $2.19M?

August 15, 2026

the prediction market emergency that could redraw federal-state crypto boundaries

August 15, 2026

CLARITY Act odds fall to10%

August 15, 2026
Get Informed

Subscribe to Updates

Get the latest creative news From Crypto Daily Pulse directly in your Inbox!

  • Contact
  • Privacy Policy
  • Terms & Conditions
© 2026 Crypto Pulse Daily - All rights reserved.

Type above and press Enter to search. Press Esc to cancel.

Cleantalk Pixel
  • bitcoinBitcoin(BTC)$63,078.000.30%
  • ethereumEthereum(ETH)$1,882.700.20%
  • tetherTether(USDT)$1.000.00%
  • binancecoinBNB(BNB)$608.610.40%
  • usd-coinUSDC(USDC)$1.000.00%
  • rippleXRP(XRP)$1.000.60%
  • solanaSolana(SOL)$75.490.50%
  • tronTRON(TRX)$0.331194-0.30%
  • Figure HelocFigure Heloc(FIGR_HELOC)$1.00-0.50%
  • HyperliquidHyperliquid(HYPE)$56.851.80%