Close Menu
  • Latest News
    • Market
    • Altcoins
    • Legal and Regulatory
  • Tech
    • Blockchain
    • Security and Privacy
  • Web 3
    • Web3 News
    • NFTs
    • Gaming
  • Learn
    • Education
    • Investments
    • Staking
    • Wallets and Exchanges
  • ICOs
  • Mining
  • Crypto Tools
    • Exchange Tool
  • Shop
What's Hot

Abu Dhabi’s LuLuFin Tests CreataChain in Blockchain Interoperability Sandbox

July 25, 2026

CLARITY Act Delay Shows Crypto Market Structure Fight Is Not Over

July 25, 2026

South Korea Panel Recommends Easing Crypto Firm Shareholder Rules, Paving Way for Naver-Dunamu Deal

July 25, 2026
Facebook X (Twitter) Instagram
  • Contact
  • Privacy Policy
  • Terms & Conditions
Facebook X (Twitter) Instagram
CryptoPulseDaily.com
  • Latest News
    • Market
    • Altcoins
    • Legal and Regulatory
  • Tech
    • Blockchain
    • Security and Privacy
  • Web 3
    • Web3 News
    • NFTs
    • Gaming
  • Learn
    • Education
    • Investments
    • Staking
    • Wallets and Exchanges
  • ICOs
  • Mining
  • Crypto Tools
    • Exchange Tool
  • Shop
CryptoPulseDaily.com
Home»Altcoins»Ethereum’s RSI Just Hit Its Lowest Level In History, And That May Be Exactly The Point
Altcoins

Ethereum’s RSI Just Hit Its Lowest Level In History, And That May Be Exactly The Point

June 7, 2026No Comments3 Mins Read
Share
Facebook Twitter LinkedIn Pinterest Email

Ethereum’s latest price crash has pushed the cryptocurrency below $1,800, placing its monthly chart under pressure at a time when the entire crypto market sentiment has turned heavily bearish. There is also another weakness coming from the monthly RSI, which has now dropped to its lowest level since the asset launched in 2015.

That reading has made the current setup very important, as previous deep RSI resets appeared near major Ethereum cycle lows in 2020 and 2022, and there’s also a question of whether the same pattern is forming again.

Related Reading

RSI Hits Its Lowest Level Since Ethereum’s Launch

Ethereum has endured a brutal nine months since it peaked at $4,946 in August 2025. The brutal price action has culminated in a break below $1,800 in June, with the leading altcoin falling to as low as $1,536 in the past 24 hours, which is its lowest price level so far in 2026.

Interestingly, that crash has caused the monthly Relative Strength Index (RSI) on ETH/USD to print its lowest reading since Ethereum’s launch in 2015. The monthly RSI indicator chart shows the index dropping to around 40, its lowest level on the monthly timeframe since ETH began trading in 2015.
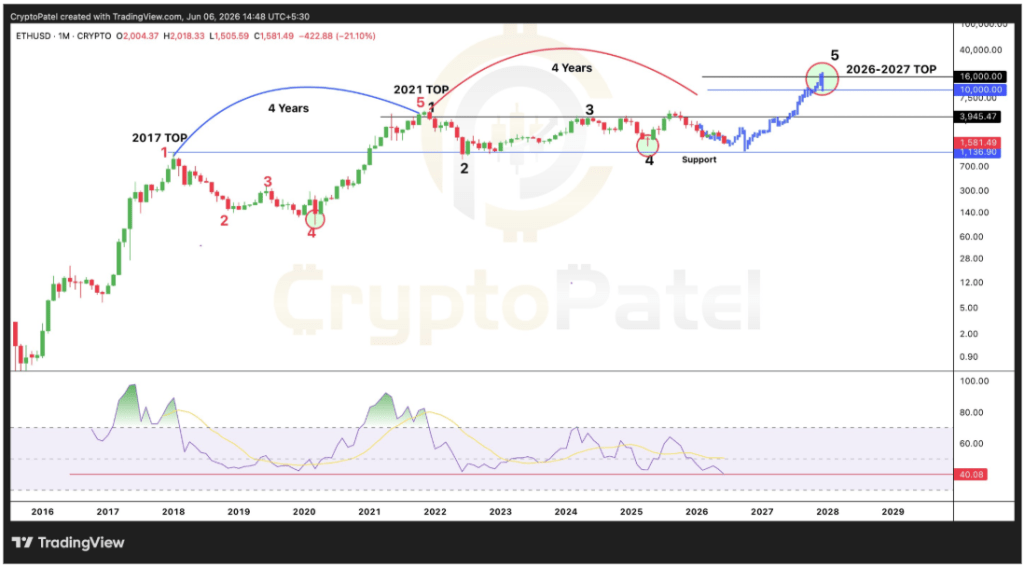
Ethereum Price Chart. Source: @CryptoPatel On X

What Does This Mean For Ethereum?

Back in 2020, Ethereum’s RSI reached a depressed level before ETH began a massive rally from around $88 to its 2021 peak above $4,800. Again in 2022, another deep RSI reset came before ETH eventually rallied from around $880 to its 2025 all-time high.

See also  Toncoin’s volume explodes 148% – Is TON finally ready to break out?
ETHUSD currently at $1,629. Chart: TradingView

The current setup is not a guarantee that these same rallies will repeat, but it does show that Ethereum is now in the type of momentum zone that has always appeared closer to major bottoms than cycle tops. 

A notable difference this time is that the RSI has gone even lower, making the 2026 reading the most extreme in the cryptocurrency’s history. If history repeats itself, the ensuing rally might be even larger than those seen in the previous cycles.

Technical analysis of the monthly candlestick timeframe presents Ethereum as moving through another four-year cycle, similar to the move from the 2017 top to the 2021 top. As shown in the chart image above, the 2017 cycle peak is the first major top, the 2021 peak is the next major cycle high, and then there is a projection of a possible top around $10,000 sometime in 2026-2027.

Related Reading

At the time of writing, Ethereum is trading at $1,612, leaving bulls with the immediate task of defending the $1,600 region with stronger inflows. Speaking of inflows, Spot Ethereum ETFs ended a 17-day streak of outflows on Thursday, June 4, after recording $19 million in net inflows. However, that relief was short-lived, as Friday’s session returned to negative territory with $5.97 million in net outflows.

Featured image from Unsplash, chart from TradingView

Source link

Ethereums history Hit Level lowest point RSI
Share. Facebook Twitter Pinterest LinkedIn Tumblr Email

Related Posts

CLARITY Act Delay Shows Crypto Market Structure Fight Is Not Over

July 25, 2026

‘Patience is the trade’: Why Coinbase is cautious over Bitcoin in Q3 

July 25, 2026

Audiera – THIS breakout could send BEAT to $4 ONLY IF…

July 25, 2026

BitMEX Faces Proposed Class Action Seeking Return Of 622 BTC

July 25, 2026
Add A Comment
Leave A Reply Cancel Reply

Top Posts

Another American Crypto Exchange Faces A $1.2M Penalty: CoinList Vs OFAC

December 16, 2023

Web3’s First Handheld Gaming Device

April 12, 2024

Heroes of Mavia Plans MAVIA Token Airdrop

January 10, 2024

Subscribe to Updates

Get the latest creative news From Crypto Daily Pulse directly in your Inbox!

Our mission is to develop a community of people who try to make financially sound decisions. The website strives to educate individuals in making wise choices about Crypto, ICOs, Web3, Blockchain and more.

We're social. Connect with us:

Facebook X (Twitter) Instagram Pinterest YouTube
Top Insights

Abu Dhabi’s LuLuFin Tests CreataChain in Blockchain Interoperability Sandbox

July 25, 2026

CLARITY Act Delay Shows Crypto Market Structure Fight Is Not Over

July 25, 2026

South Korea Panel Recommends Easing Crypto Firm Shareholder Rules, Paving Way for Naver-Dunamu Deal

July 25, 2026
Get Informed

Subscribe to Updates

Get the latest creative news From Crypto Daily Pulse directly in your Inbox!

  • Contact
  • Privacy Policy
  • Terms & Conditions
© 2026 Crypto Pulse Daily - All rights reserved.

Type above and press Enter to search. Press Esc to cancel.

Cleantalk Pixel
  • bitcoinBitcoin(BTC)$64,117.00-0.90%
  • ethereumEthereum(ETH)$1,865.67-0.40%
  • tetherTether(USDT)$1.000.00%
  • binancecoinBNB(BNB)$566.340.80%
  • usd-coinUSDC(USDC)$1.000.00%
  • rippleXRP(XRP)$1.09-0.70%
  • solanaSolana(SOL)$73.85-1.10%
  • tronTRON(TRX)$0.329565-0.30%
  • Figure HelocFigure Heloc(FIGR_HELOC)$1.02-2.20%
  • whitebitWhiteBIT Coin(WBT)$55.92-0.80%