Close Menu
  • Latest News
    • Market
    • Altcoins
    • Legal and Regulatory
  • Tech
    • Blockchain
    • Security and Privacy
  • Web 3
    • Web3 News
    • NFTs
    • Gaming
  • Learn
    • Education
    • Investments
    • Staking
    • Wallets and Exchanges
  • ICOs
  • Mining
  • Crypto Tools
    • Exchange Tool
  • Shop
What's Hot

Connecting U.S. Stock with the On-Chain Ecosystem to Reshape Asset Circulation

November 7, 2026

Crypto ally French Hill wins reelection but set to lose House chair

November 7, 2026

Constellation Software Inc. Announces Results for the Third Quarter Ended September 30, 2026 and Declares Quarterly Dividend

November 7, 2026
Facebook X (Twitter) Instagram
  • Contact
  • Privacy Policy
  • Terms & Conditions
Facebook X (Twitter) Instagram
CryptoPulseDaily.com
  • Latest News
    • Market
    • Altcoins
    • Legal and Regulatory
  • Tech
    • Blockchain
    • Security and Privacy
  • Web 3
    • Web3 News
    • NFTs
    • Gaming
  • Learn
    • Education
    • Investments
    • Staking
    • Wallets and Exchanges
  • ICOs
  • Mining
  • Crypto Tools
    • Exchange Tool
  • Shop
CryptoPulseDaily.com
Home»Altcoins»Here why AVAX’s rally must pass THIS ‘structural test’ on the charts
Altcoins

Here why AVAX’s rally must pass THIS ‘structural test’ on the charts

September 19, 2026No Comments3 Mins Read
Share
Facebook Twitter LinkedIn Pinterest Email

Avalanche [AVAX] has exhibited clear bullish tendencies lately. In fact, its most recent daily swing saw the altcoin post a double-digit percentage surge in price, with over 12% gains.

The rally still remains questionable in terms of sustainability though. Will the uptrend hold when viewed from the lens of the 1-month Liquidation Heatmap?

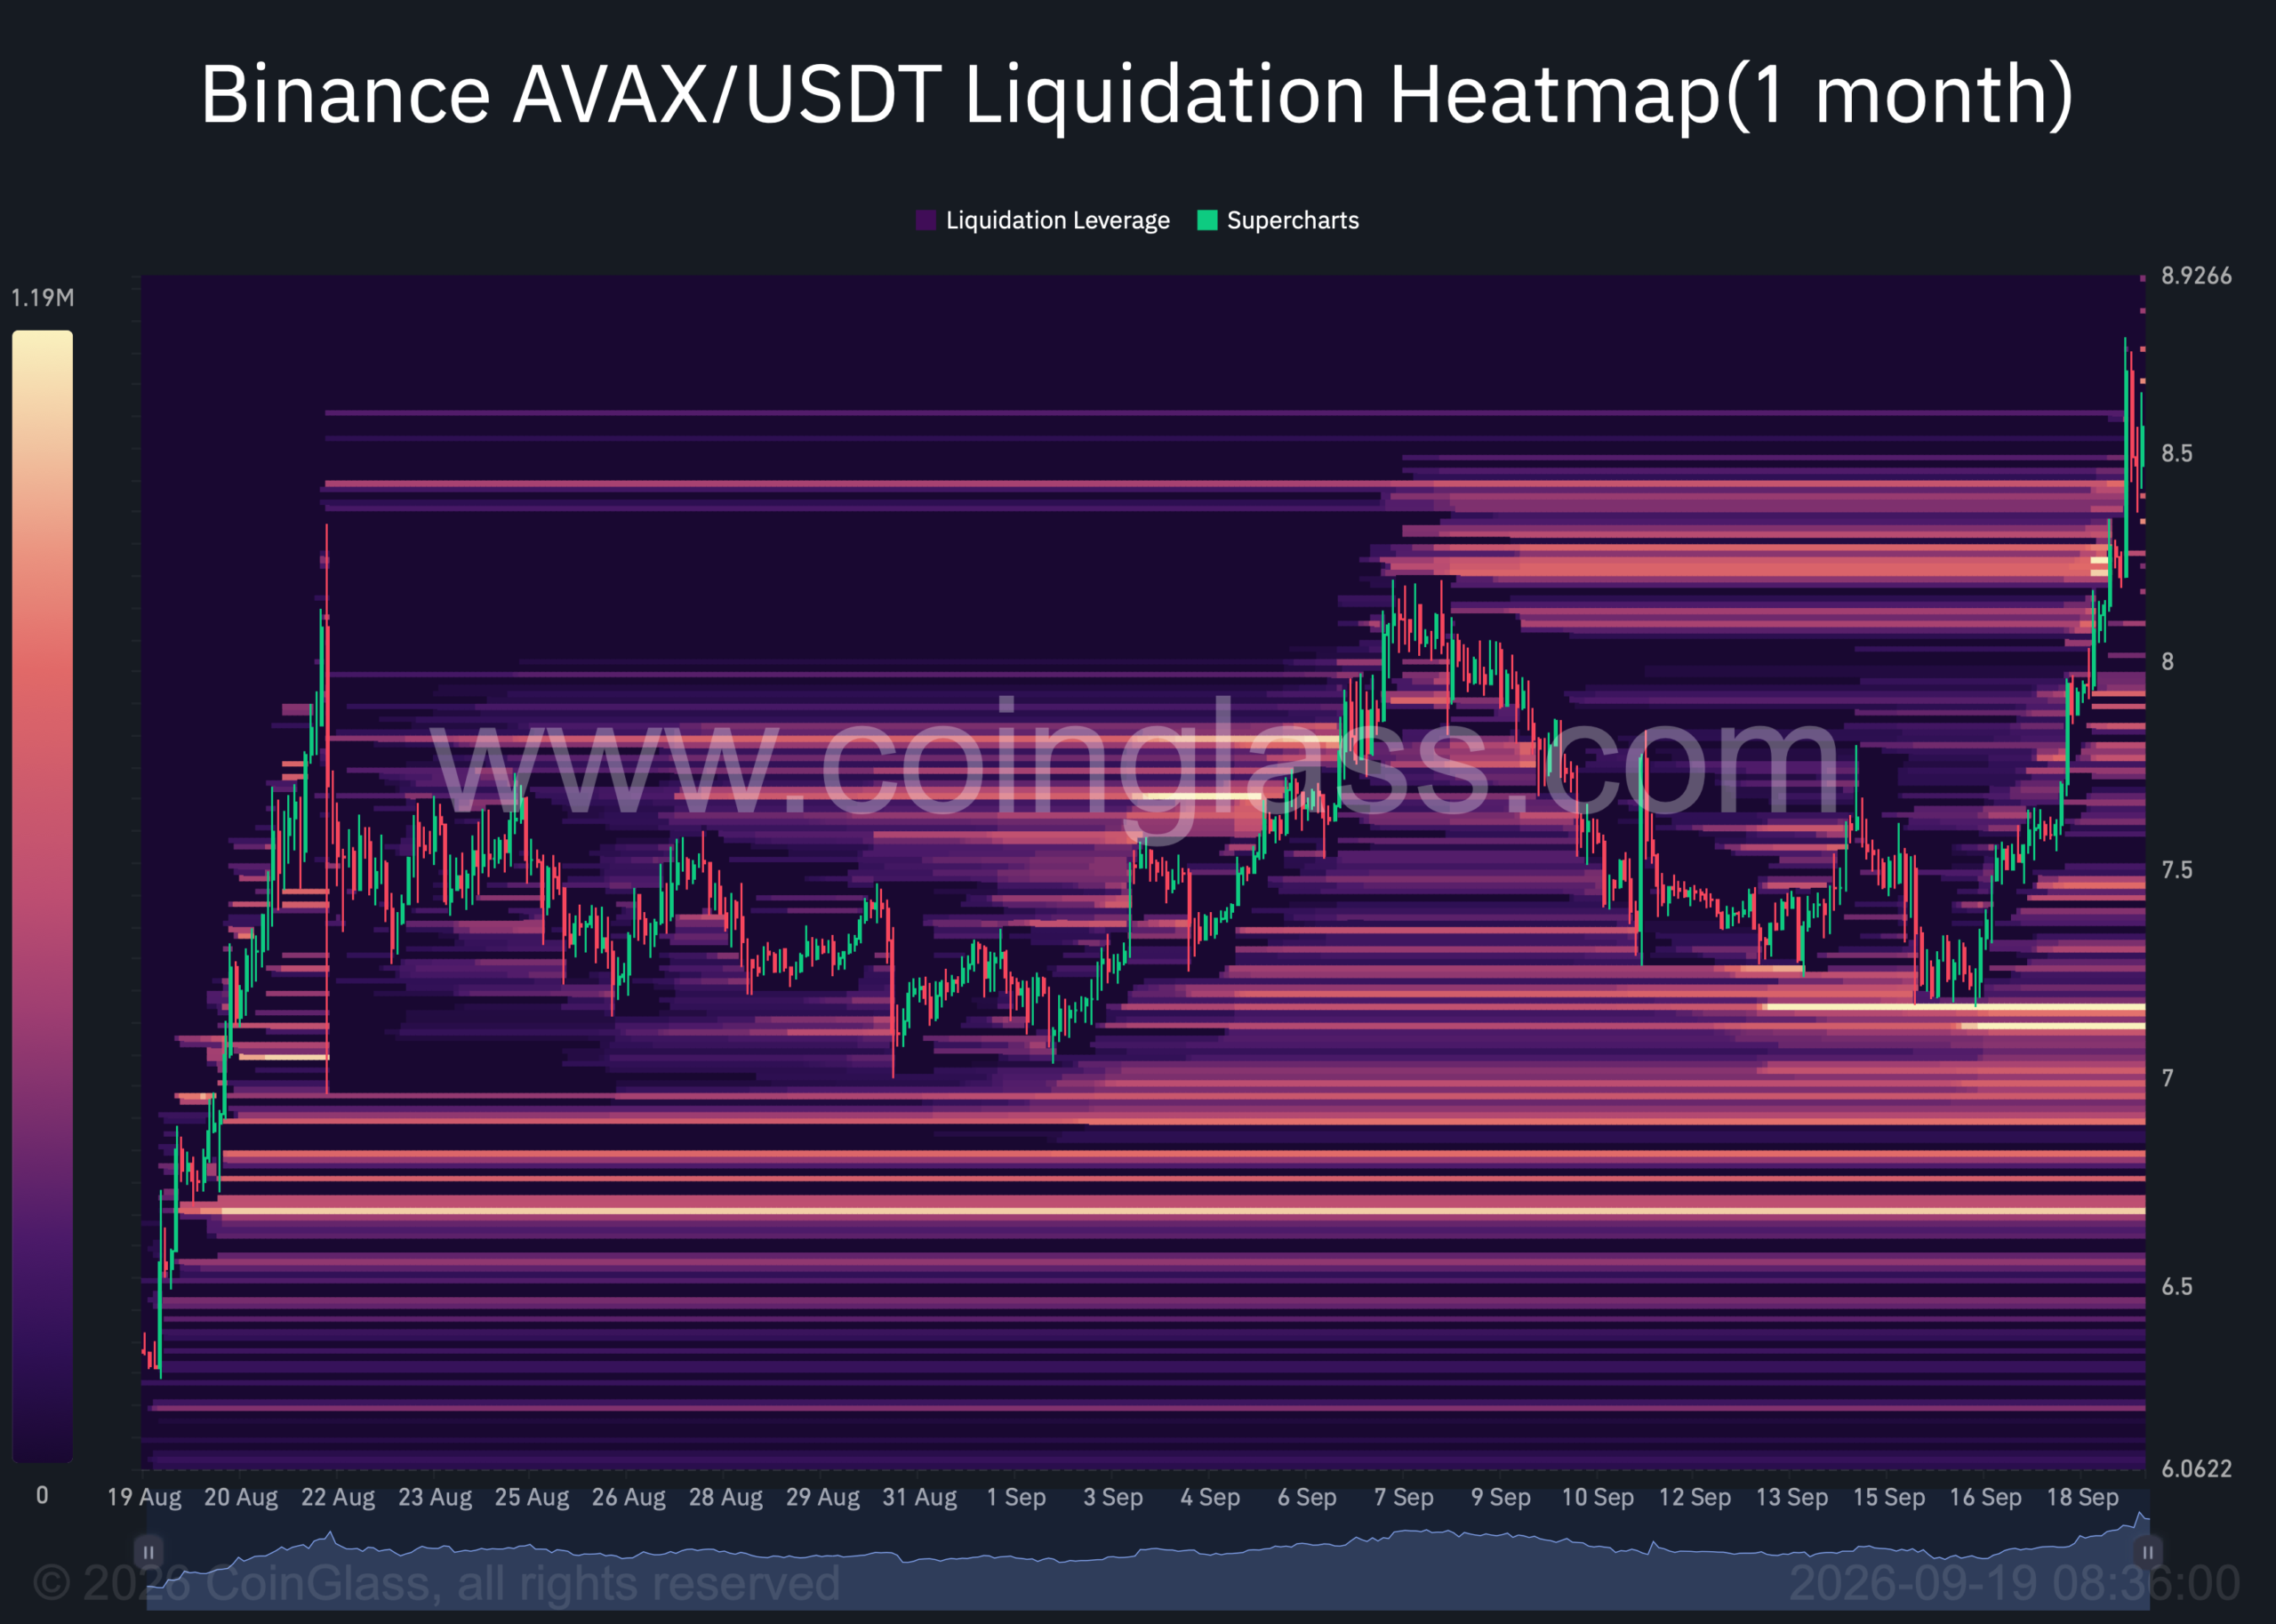
Well, the chart revealed that there seemed to be limited to no upside liquidity cluster. On the contrary, there were multiple clusters with strong depth below the press time price.
AVAX liquidation chart.AVAX liquidation chart.
Source: CoinGlass

Clusters measure areas of unfilled orders on the price chart. These levels often act as magnets, pulling the price towards themselves.

There are two scenarios likely to happen in the market. The limited to no upside liquidity cluster above the price means that AVAX could depend on momentum to surge further. On the flip side, however, the downward clusters could see the price pulled lower, causing AVAX to lose its recent gains.

Liquidity clusters leave AVAX’s rally vulnerable

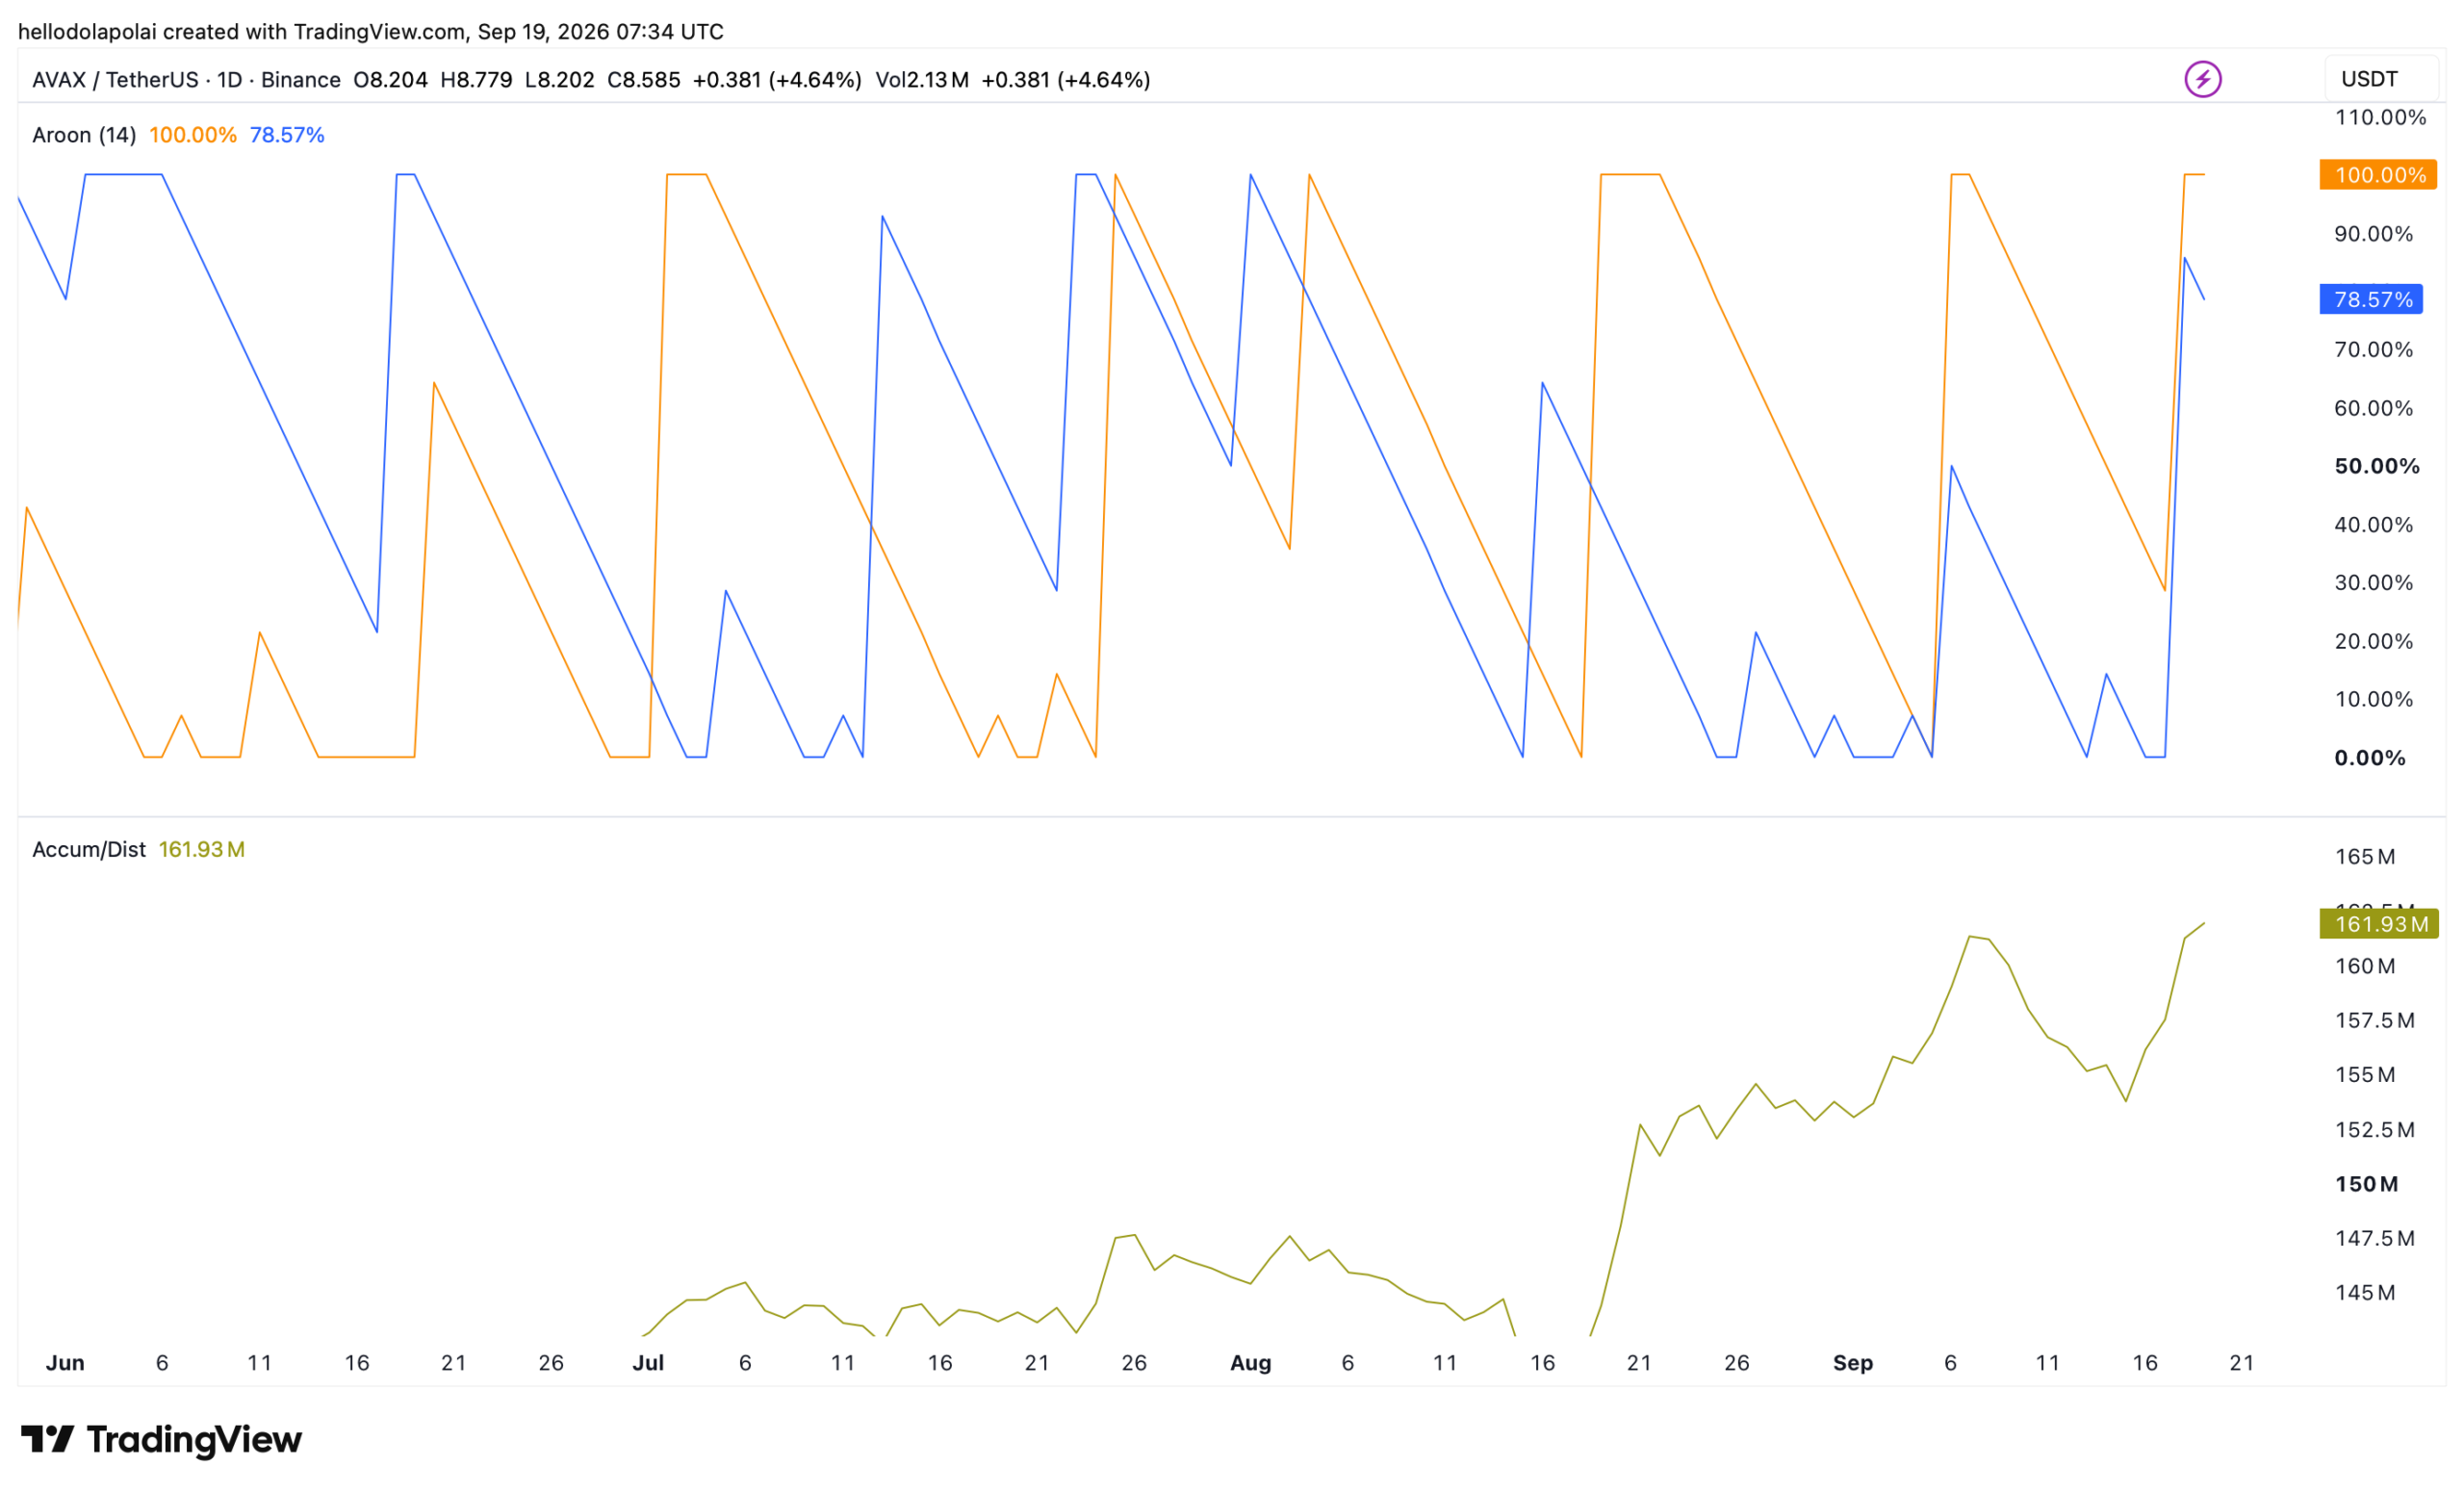
At the time of writing, clear accumulation was still ongoing for AVAX in the market. The Accumulation/Distribution Indicator (A/D) revealed that there’s been massive buying as the volume-weighted purchase hit 122 million.

A hike in accumulation is indicative of where investor sentiment lies and their expectations, especially in the near term. In this case, however, while accumulation seemed to be ongoing, it didn’t seem to be a clear-cut signal according to the Aroon Indicator.
AVAX Aroon and accumulation distribution indicator.AVAX Aroon and accumulation distribution indicator.
Source: TradingView

This indicator uses two lines, Aroon Up (Orange) and Aroon Down (Blue), to show the market’s directional bias over price. It seemed to confirm that AVAX was bullish, with the Aroon Up above Aroon Down. The scale of bullishness was low though.

See also  Monad retraces after rally: Is MON's $0.030 support strong enough?

This, because the gap between Aroon Up and Aroon Down was minimal. A bullish confirmation would stem from a noticeable gap, usually with Aroon Up at 100% while Aroon Down is at 0.00%.

AVAX needs to clear the lower high

At the time of writing, there wasn’t much indication about the price action’s next direction.

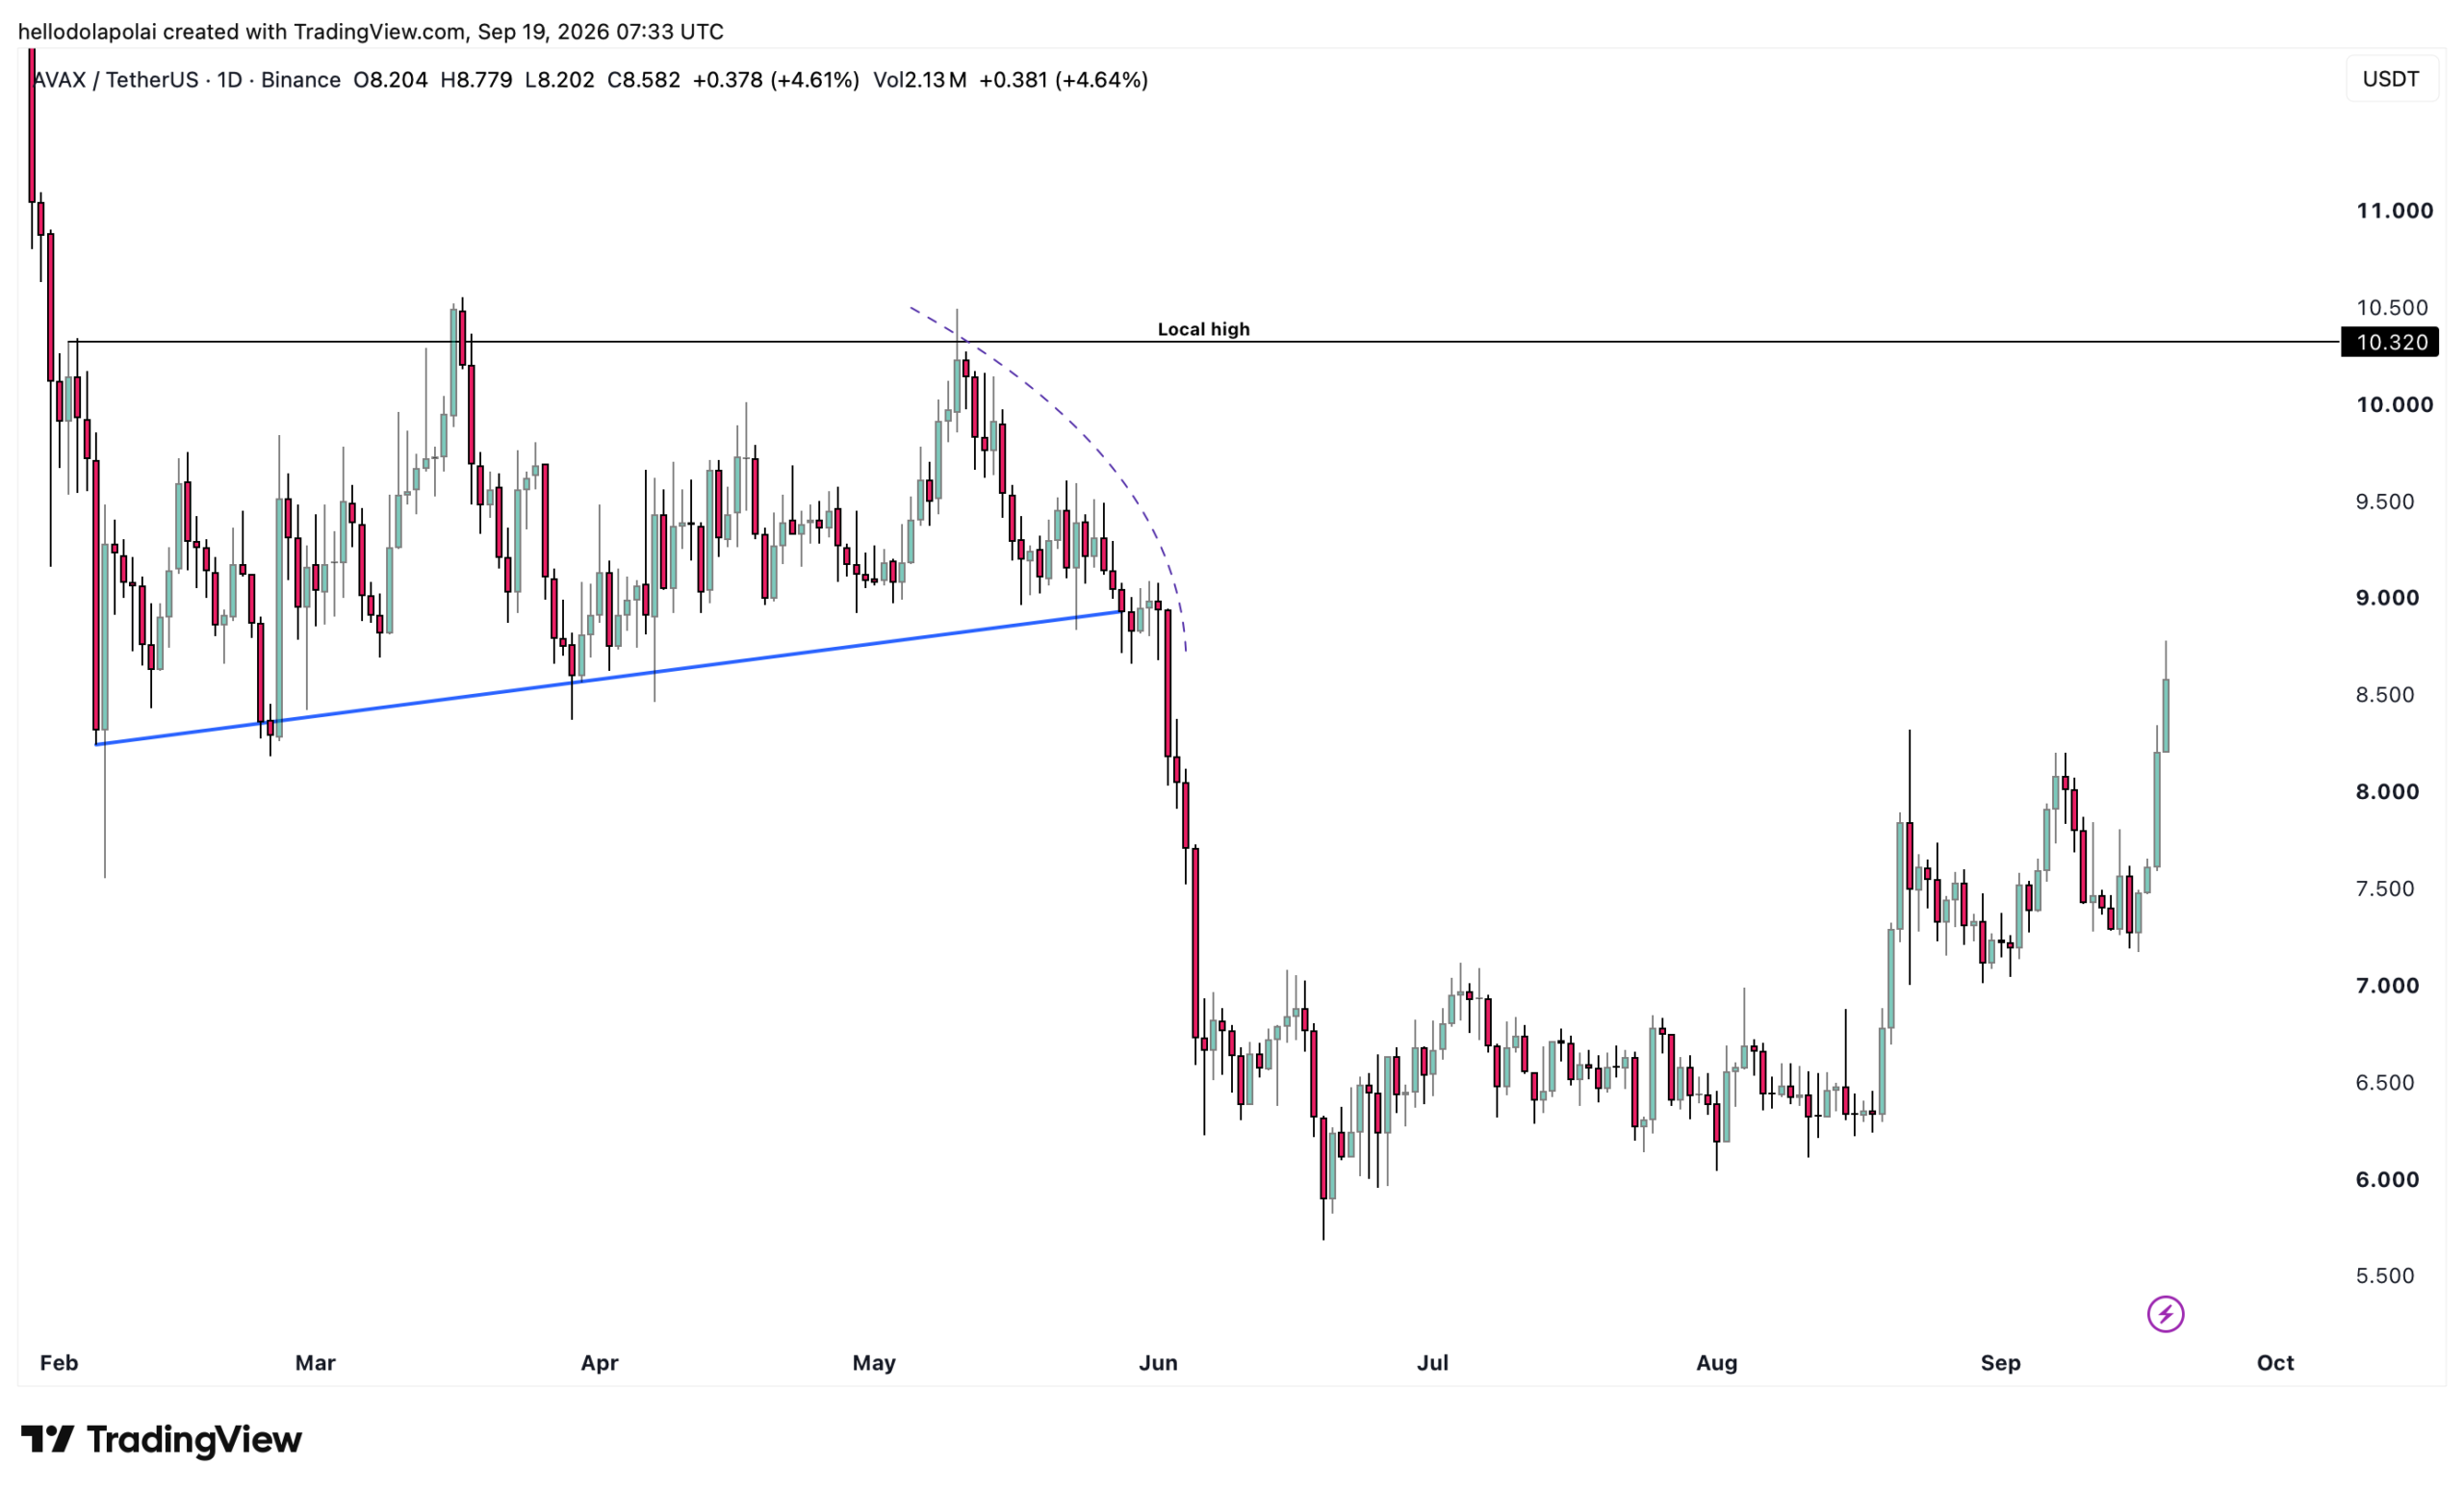
However, in case of a confirmed bullish run, the price would need to clear out the liquidity levels ahead of it and see a decisive trading-day close above the lower high level.

The price closing and trading above the lower high would nullify the structural leg down the asset has suffered in prior weeks, as well as the bearish trend.
AVAX price chart.AVAX price chart.
Source: TradingView

A sustained rally from AVAX would need the price to maintain its bullish momentum. If not, there’s a strong chance that the price could see lower levels from here on.


Final Summary

  • AVAX’s bullish momentum remains intact, but limited upside liquidity clusters could make further gains dependent on sustained buying pressure.

  • Decisive close above the lower high could strengthen the bullish structure.

Source link

AVAXs charts Pass rally structural Test
Share. Facebook Twitter Pinterest LinkedIn Tumblr Email

Related Posts

Connecting U.S. Stock with the On-Chain Ecosystem to Reshape Asset Circulation

November 7, 2026

Chainlink price prediction: How LINK can avoid a breakdown below $8

November 7, 2026

Why aren’t XLM crypto traders betting big before the 23 November vote?

November 6, 2026

DSA’s Adrian Wall and Former CFTC Chair Chris Giancarlo Discuss Future of U.S. Crypto Regulation at Strobe Summit

November 6, 2026
Add A Comment
Leave A Reply Cancel Reply

Top Posts

Bitcoin: Watch out for these as BTC sends mixed signals

January 16, 2024

FTX and Genesis Reach Agreement in Ongoing Bankruptcy Dispute

July 28, 2023

Relay Protocol Warns of Robinhood Chain Honeypot Coins

July 9, 2026

Subscribe to Updates

Get the latest creative news From Crypto Daily Pulse directly in your Inbox!

Our mission is to develop a community of people who try to make financially sound decisions. The website strives to educate individuals in making wise choices about Crypto, ICOs, Web3, Blockchain and more.

We're social. Connect with us:

Facebook X (Twitter) Instagram Pinterest YouTube
Top Insights

Connecting U.S. Stock with the On-Chain Ecosystem to Reshape Asset Circulation

November 7, 2026

Crypto ally French Hill wins reelection but set to lose House chair

November 7, 2026

Constellation Software Inc. Announces Results for the Third Quarter Ended September 30, 2026 and Declares Quarterly Dividend

November 7, 2026
Get Informed

Subscribe to Updates

Get the latest creative news From Crypto Daily Pulse directly in your Inbox!

  • Contact
  • Privacy Policy
  • Terms & Conditions
© 2026 Crypto Pulse Daily - All rights reserved.

Type above and press Enter to search. Press Esc to cancel.

Cleantalk Pixel
  • bitcoinBitcoin(BTC)$75,784.00-0.10%
  • ethereumEthereum(ETH)$2,239.820.32%
  • tetherTether(USDT)$1.000.02%
  • binancecoinBNB(BNB)$692.980.01%
  • rippleXRP(XRP)$1.16-4.15%
  • usd-coinUSDC(USDC)$1.000.02%
  • solanaSolana(SOL)$89.800.03%
  • tronTRON(TRX)$0.317617-0.19%
  • Figure HelocFigure Heloc(FIGR_HELOC)$1.02-1.26%
  • zcashZcash(ZEC)$1,325.383.08%