Close Menu
  • Latest News
    • Market
    • Altcoins
    • Legal and Regulatory
  • Tech
    • Blockchain
    • Security and Privacy
  • Web 3
    • Web3 News
    • NFTs
    • Gaming
  • Learn
    • Education
    • Investments
    • Staking
    • Wallets and Exchanges
  • ICOs
  • Mining
  • Crypto Tools
    • Exchange Tool
  • Shop
What's Hot

Taurus brings full Hedera stack to 40+ banks

August 8, 2026

New XRP Ledger proposals target $530 million in tokenized Wall Street assets

August 8, 2026

‘No bundled risk’- Why Ether.Fi has removed all restaking exposure to weETH

August 8, 2026
Facebook X (Twitter) Instagram
  • Contact
  • Privacy Policy
  • Terms & Conditions
Facebook X (Twitter) Instagram
CryptoPulseDaily.com
  • Latest News
    • Market
    • Altcoins
    • Legal and Regulatory
  • Tech
    • Blockchain
    • Security and Privacy
  • Web 3
    • Web3 News
    • NFTs
    • Gaming
  • Learn
    • Education
    • Investments
    • Staking
    • Wallets and Exchanges
  • ICOs
  • Mining
  • Crypto Tools
    • Exchange Tool
  • Shop
CryptoPulseDaily.com
Home»Altcoins»Here’s how Ethereum traders can navigate short-term trends
Altcoins

Here’s how Ethereum traders can navigate short-term trends

July 11, 2023No Comments3 Mins Read
Share
Facebook Twitter LinkedIn Pinterest Email

Disclaimer: The information presented does not constitute financial, investment, trading, or other types of advice and is solely the writer’s opinion.

  • The price action of Ethereum in the past three weeks showed large volatility and no clear trend.
  • The psychological level at $1900 was retested as resistance in recent hours.

Ethereum [ETH] showed some conflicting signs on the higher timeframe charts. The asset has been on an uptrend in 2023 after the move above $1350, but the trend shifted bearishly in mid-April.


Read Ethereum’s [ETH] Price Prediction 2023-24


On 16 June, ETH dropped as low as $1626 before rallying to $1976 on 3 July. This signified a bullish structure- but is ETH ready to rally?

The lower timeframe picture was clearer. The 4-hour chart showed a strong possibility that Ethereum is preparing for the next big move. The price was in a phase of consolidation, but can the bulls drive another rally?

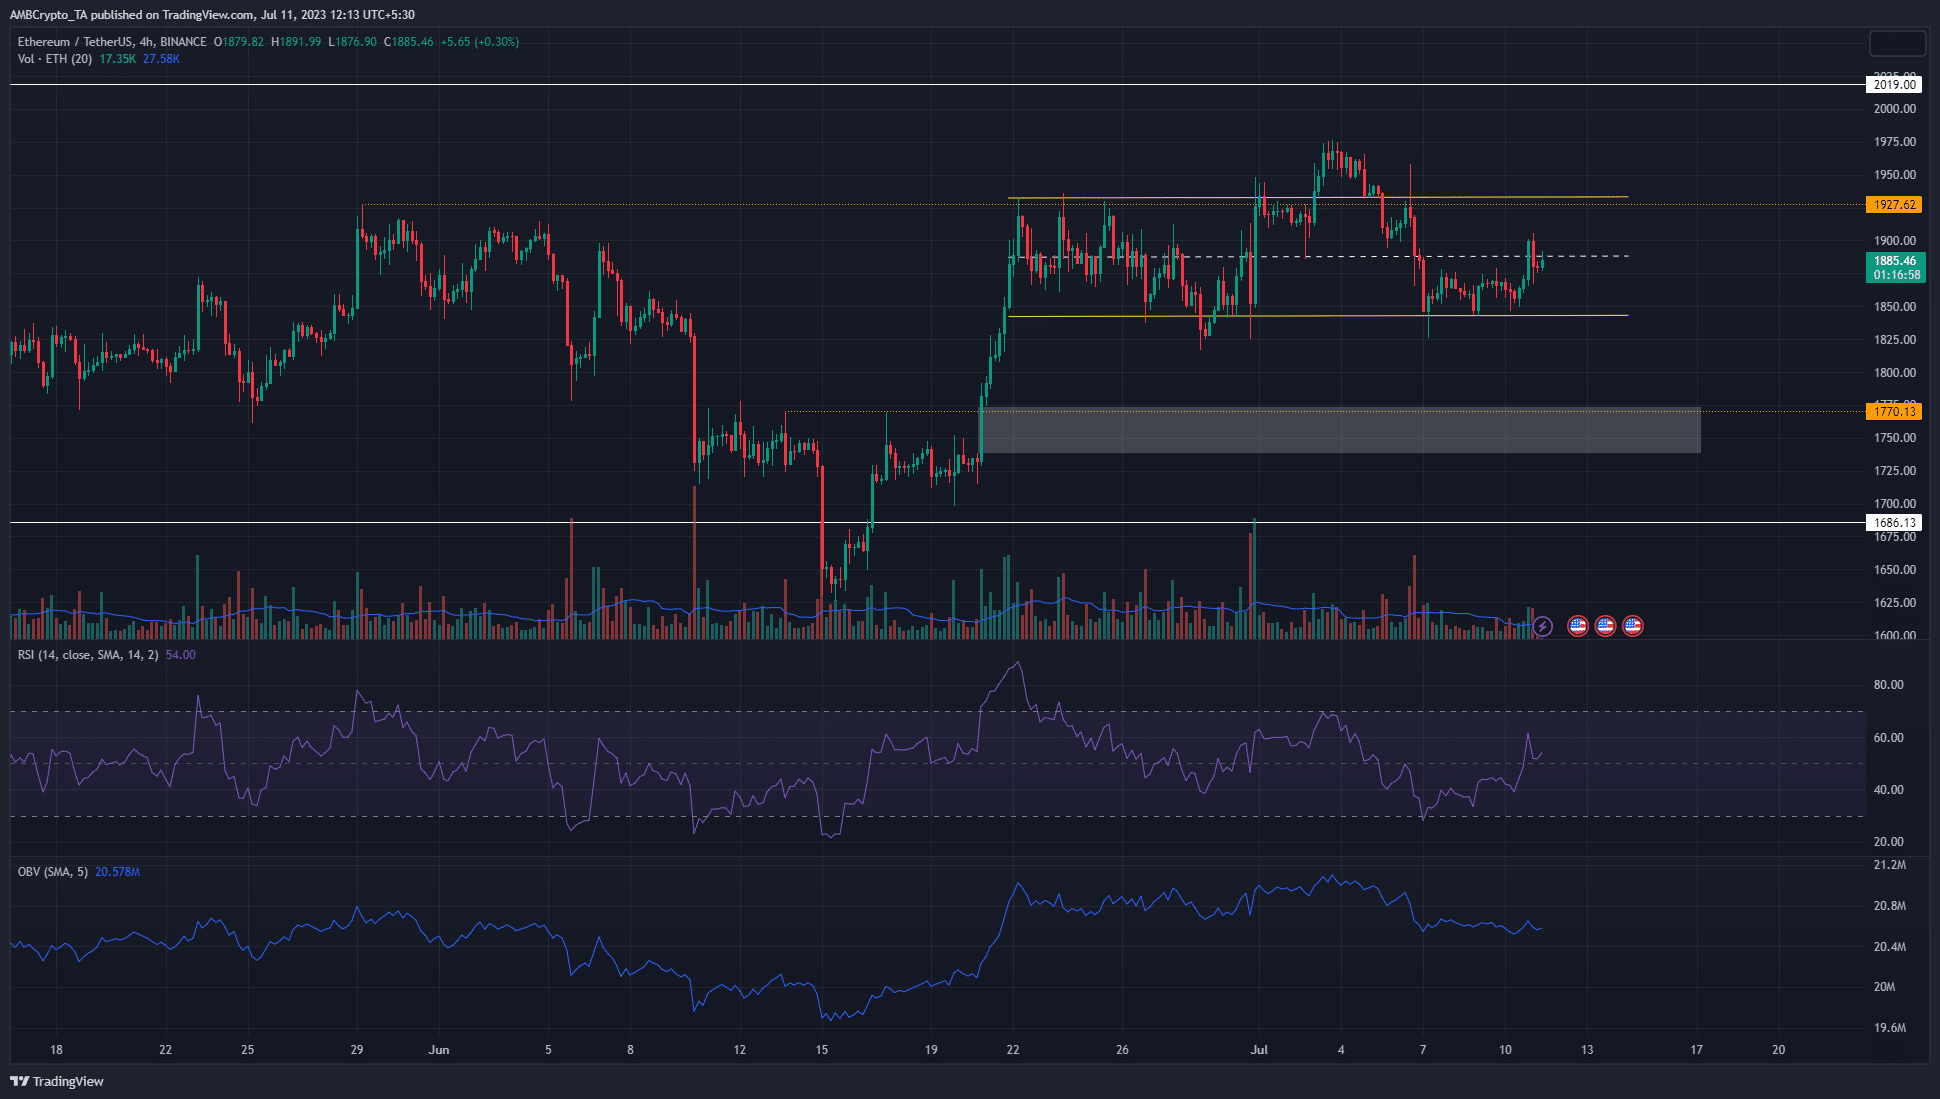
The rejection from $1978 saw selling pressure dominate

Here's what the short-term Ethereum price action reveals about the longer-term trend

Source: ETH/USDT on TradingView

A range formation between $1843 and $1934 was highlighted in yellow. The brief breakout above this range in early July was quickly swatted down by the bears. Moreover, the OBV, which had been trending higher until then, declined.

Over the past week, the OBV continued to drop as the price dropped to the range lows. A candlewick to the $1826 mark on 7 July saw a quick reversal, which suggested that the bulls were not ready to give up on the range formation yet.

The RSI oscillated between bullish and bearish territory over the past few days to indicate the lack of a trend. However, on lower timeframes such as 1-hour, there was momentum for traders to profit from.

See also  Crypto Market Analysis: Shiba Inu (SHIB) And Litecoin (LTC) Prices Rebound From Robust Support Zone – What’s Next?

But, given the decline in OBV, the consolidation phase could be followed by a downtrend for Ethereum. Until the range lows are ceded to the bears, buyers can look to bid in the $1840-$1860 targeting the high at $1935.

The spot CVD remained flat despite Ethereum’s bounce from the range lows

Here's what the short-term Ethereum price action reveals about the longer-term trend

Source: Coinalyze


How much are 1,10,100 ETHs worth today?


On 7 July, after the dip below $1830, Ethereum prices recovered. At the time of writing, ETH was trading at $1885 after rejection from $1900. Even though it was a minor bounce, the spot CVD did not climb higher.

Nor did the Open Interest budge much. It remained flat over the past few days and reflected the lack of conviction from speculators. The lack of reaction on the OI despite a minor bounce for Ethereum suggested the bullish side could be weakened.

Source link

Ethereum Heres navigate ShortTerm traders Trends
Share. Facebook Twitter Pinterest LinkedIn Tumblr Email

Related Posts

‘No bundled risk’- Why Ether.Fi has removed all restaking exposure to weETH

August 8, 2026

Bitcoin: Bottom signals strengthen, but BTC sellers retain ONE edge

August 8, 2026

Russia shuts down 9 crypto exchanges in major Moscow crackdown — Details

August 8, 2026

Ethena: Amber-linked wallet buys $3.58M, yet ENA demand stays weak

August 7, 2026
Add A Comment
Leave A Reply Cancel Reply

Top Posts

Solana (SOL) Price Predictions Amid FTX’s Ambitious $3.4 Billion Asset Sale

September 12, 2023

Your Guide to the Hamster Kombat Airdrop: How to Claim Your Share

September 2, 2024

Institutional investors have switched gears on Salvadoran bonds

August 15, 2023

Subscribe to Updates

Get the latest creative news From Crypto Daily Pulse directly in your Inbox!

Our mission is to develop a community of people who try to make financially sound decisions. The website strives to educate individuals in making wise choices about Crypto, ICOs, Web3, Blockchain and more.

We're social. Connect with us:

Facebook X (Twitter) Instagram Pinterest YouTube
Top Insights

Taurus brings full Hedera stack to 40+ banks

August 8, 2026

New XRP Ledger proposals target $530 million in tokenized Wall Street assets

August 8, 2026

‘No bundled risk’- Why Ether.Fi has removed all restaking exposure to weETH

August 8, 2026
Get Informed

Subscribe to Updates

Get the latest creative news From Crypto Daily Pulse directly in your Inbox!

  • Contact
  • Privacy Policy
  • Terms & Conditions
© 2026 Crypto Pulse Daily - All rights reserved.

Type above and press Enter to search. Press Esc to cancel.

Cleantalk Pixel
  • bitcoinBitcoin(BTC)$64,920.001.10%
  • ethereumEthereum(ETH)$1,913.500.90%
  • tetherTether(USDT)$1.000.00%
  • binancecoinBNB(BNB)$594.541.20%
  • usd-coinUSDC(USDC)$1.000.00%
  • rippleXRP(XRP)$1.031.50%
  • solanaSolana(SOL)$74.672.60%
  • tronTRON(TRX)$0.3272030.30%
  • Figure HelocFigure Heloc(FIGR_HELOC)$1.01-2.70%
  • HyperliquidHyperliquid(HYPE)$54.37-1.70%