Close Menu
  • Latest News
    • Market
    • Altcoins
    • Legal and Regulatory
  • Tech
    • Blockchain
    • Security and Privacy
  • Web 3
    • Web3 News
    • NFTs
    • Gaming
  • Learn
    • Education
    • Investments
    • Staking
    • Wallets and Exchanges
  • ICOs
  • Mining
  • Crypto Tools
    • Exchange Tool
  • Shop
What's Hot

Why Venice Token’s 11% price drop could push VVV toward $10

July 29, 2026

Galaxy Buys Second Texas Site for AI Data Centre, Shares Pare Early Gain

July 29, 2026

Why Brazil’s Booming Crypto Market Needs Urgent Oversight

July 29, 2026
Facebook X (Twitter) Instagram
  • Contact
  • Privacy Policy
  • Terms & Conditions
Facebook X (Twitter) Instagram
CryptoPulseDaily.com
  • Latest News
    • Market
    • Altcoins
    • Legal and Regulatory
  • Tech
    • Blockchain
    • Security and Privacy
  • Web 3
    • Web3 News
    • NFTs
    • Gaming
  • Learn
    • Education
    • Investments
    • Staking
    • Wallets and Exchanges
  • ICOs
  • Mining
  • Crypto Tools
    • Exchange Tool
  • Shop
CryptoPulseDaily.com
Home»Altcoins»Historical Playbook Points To $3,800 In Coming Months
Altcoins

Historical Playbook Points To $3,800 In Coming Months

August 9, 2023No Comments3 Mins Read
Share
Facebook Twitter LinkedIn Pinterest Email

Renowned analyst Josh Olszewicz has shared some compelling insights on Ethereum’s price trajectory. Drawing parallels from historical patterns, Olszewicz’s analysis suggests that Ethereum might be gearing up for a significant rally in the coming months.

Historical Pattern: Ethereum Forms Ascending Triangle

Olszewicz starts by highlighting Ethereum’s current price pattern, jokingly stating, “Ethereum: ascending triangle 450 million years in the making w/fib extensions to $3k.” This ascending triangle, characterized by a flat top and rising bottom, has been forming since May 2022, and if history is any guide, it could be a bullish sign for Ethereum.
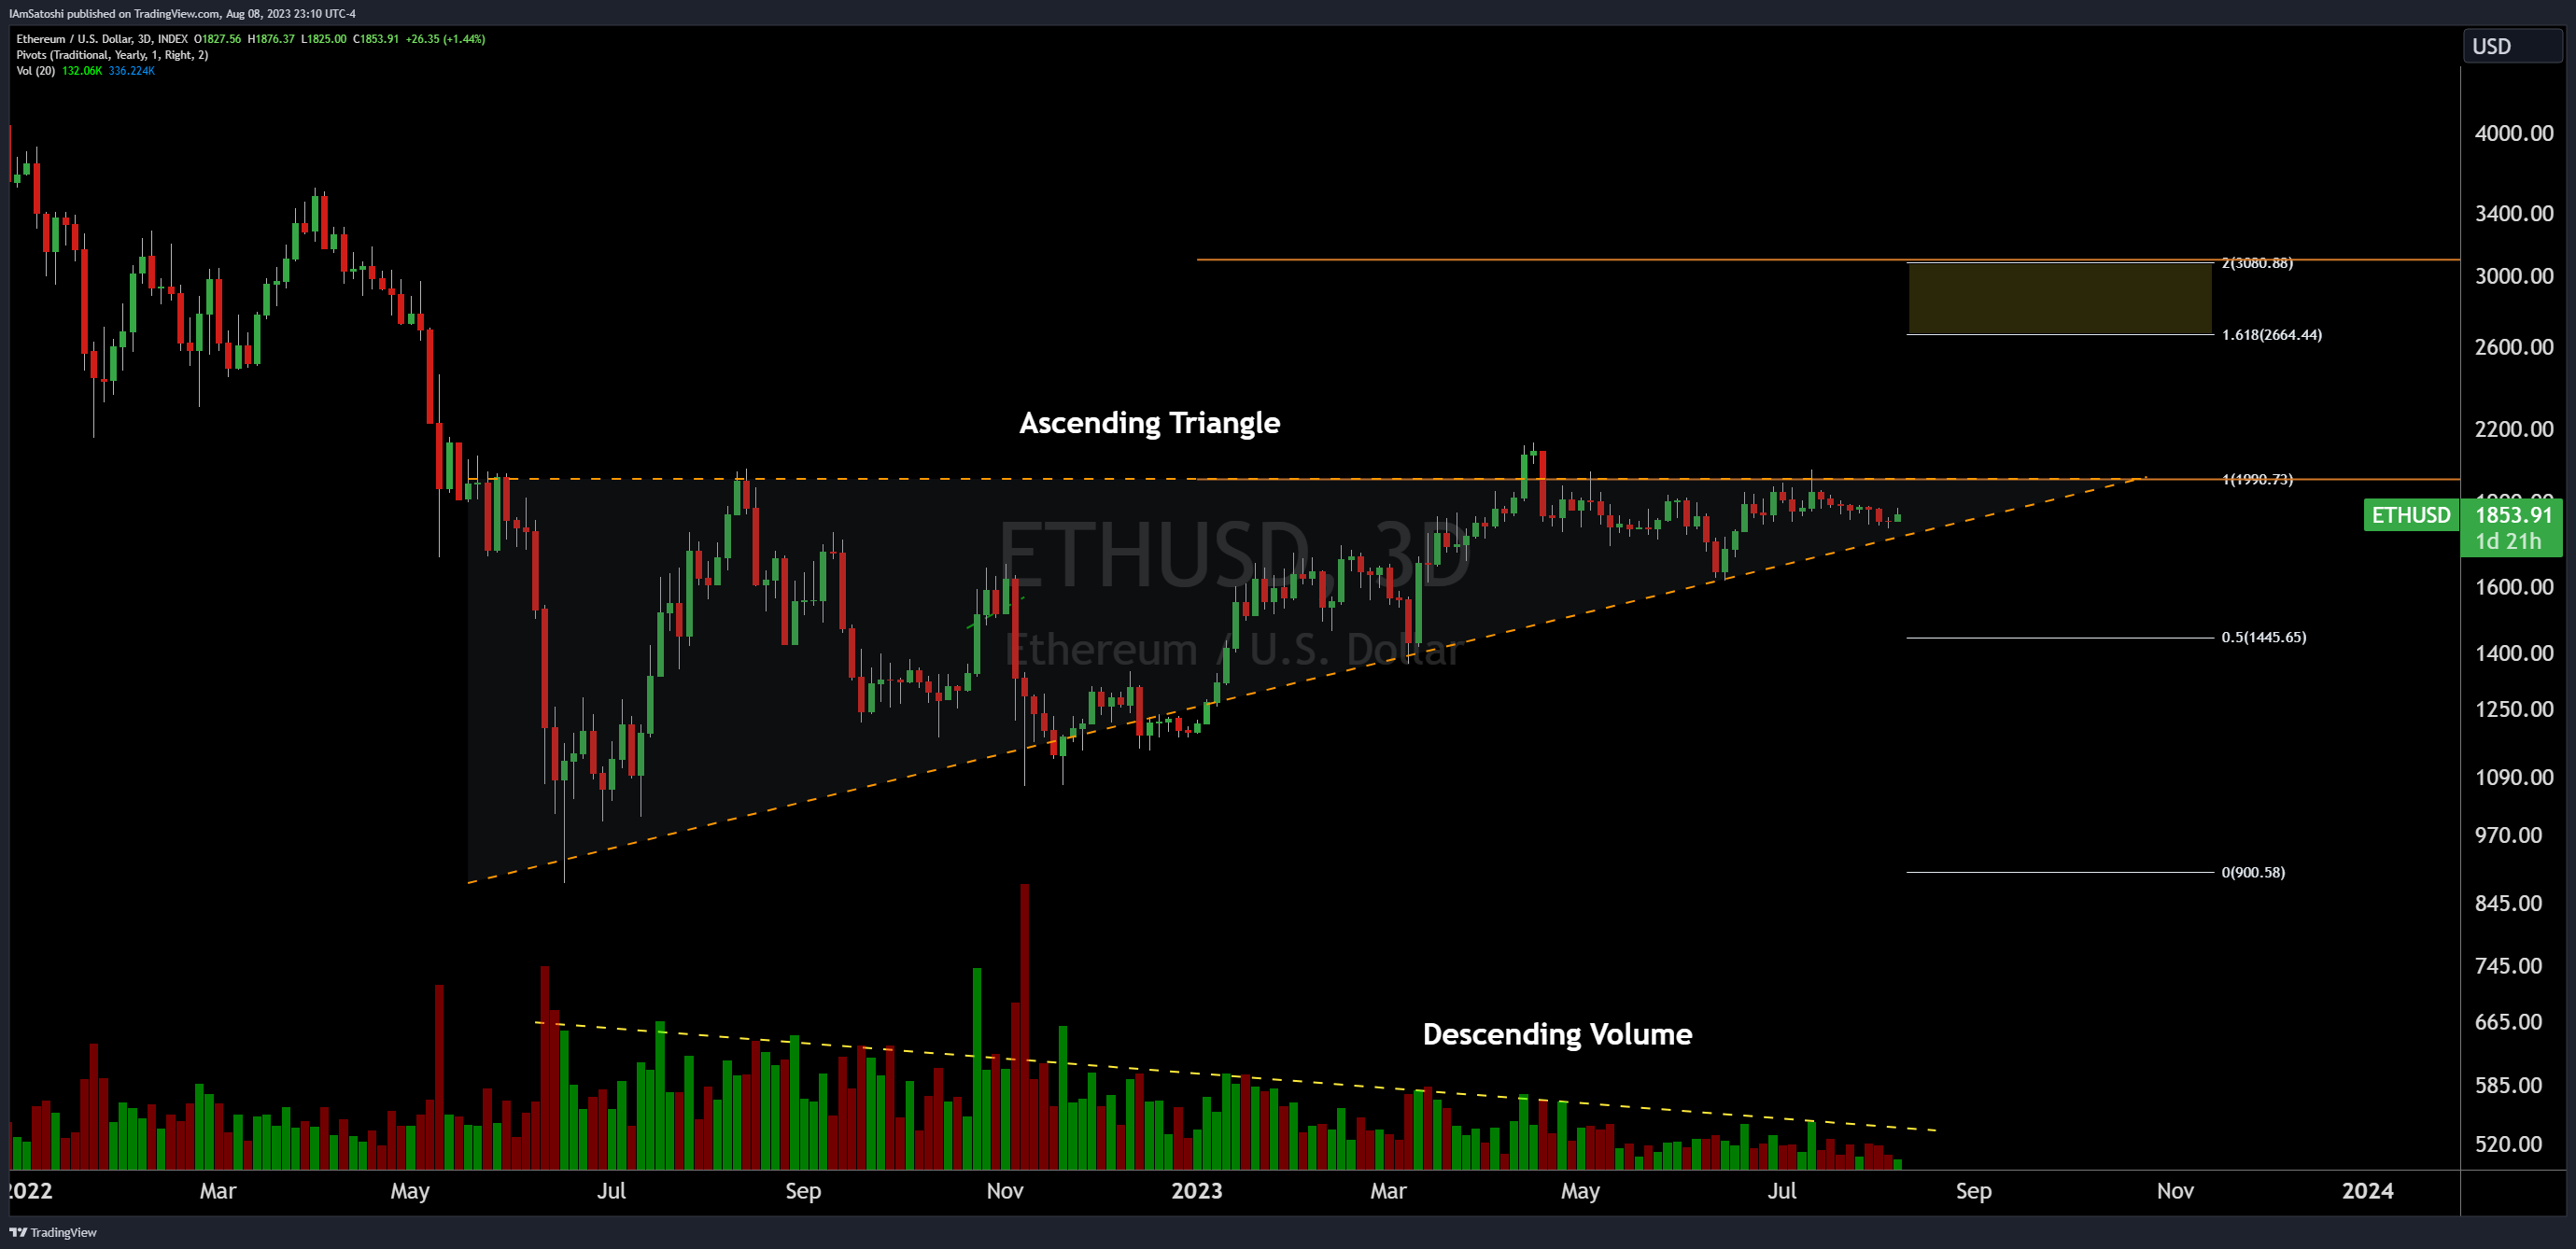
Ethereum ascending triangle
Ethereum ascending triangle | Source: Twitter @CarpeNoctom

Descending volume, another feature of this pattern, further strengthens the bullish bias. However, Olszewicz cautions that the “bias remains bullish until price breaks below diagonal support.” He also points out the psychological resistance at $2,000, noting it as an “extremely obvious signal that it’s go time, which should help the breakout.”

To bolster his analysis, Olszewicz draws parallels from Bitcoin’s past. He recalls, “take BTC in 2015/2016 [the price formed an ascending triangle for 210 days with descending volume] and BTC in 2018/2019 [ascending triangle for 130 days with descending volume] as examples.” In both instances, Bitcoin surged towards the Fibonacci extension levels post the breakout.

Ethereum itself isn’t a stranger to such patterns. Olszewicz cites, “ETH has also had previous examples in 2017 (bullish continuation) and 2019 (bullish reversal).” Each ascending triangle pattern lasted 180 days. Both times ETH surged towards the 2.618 Fibonacci extension level.
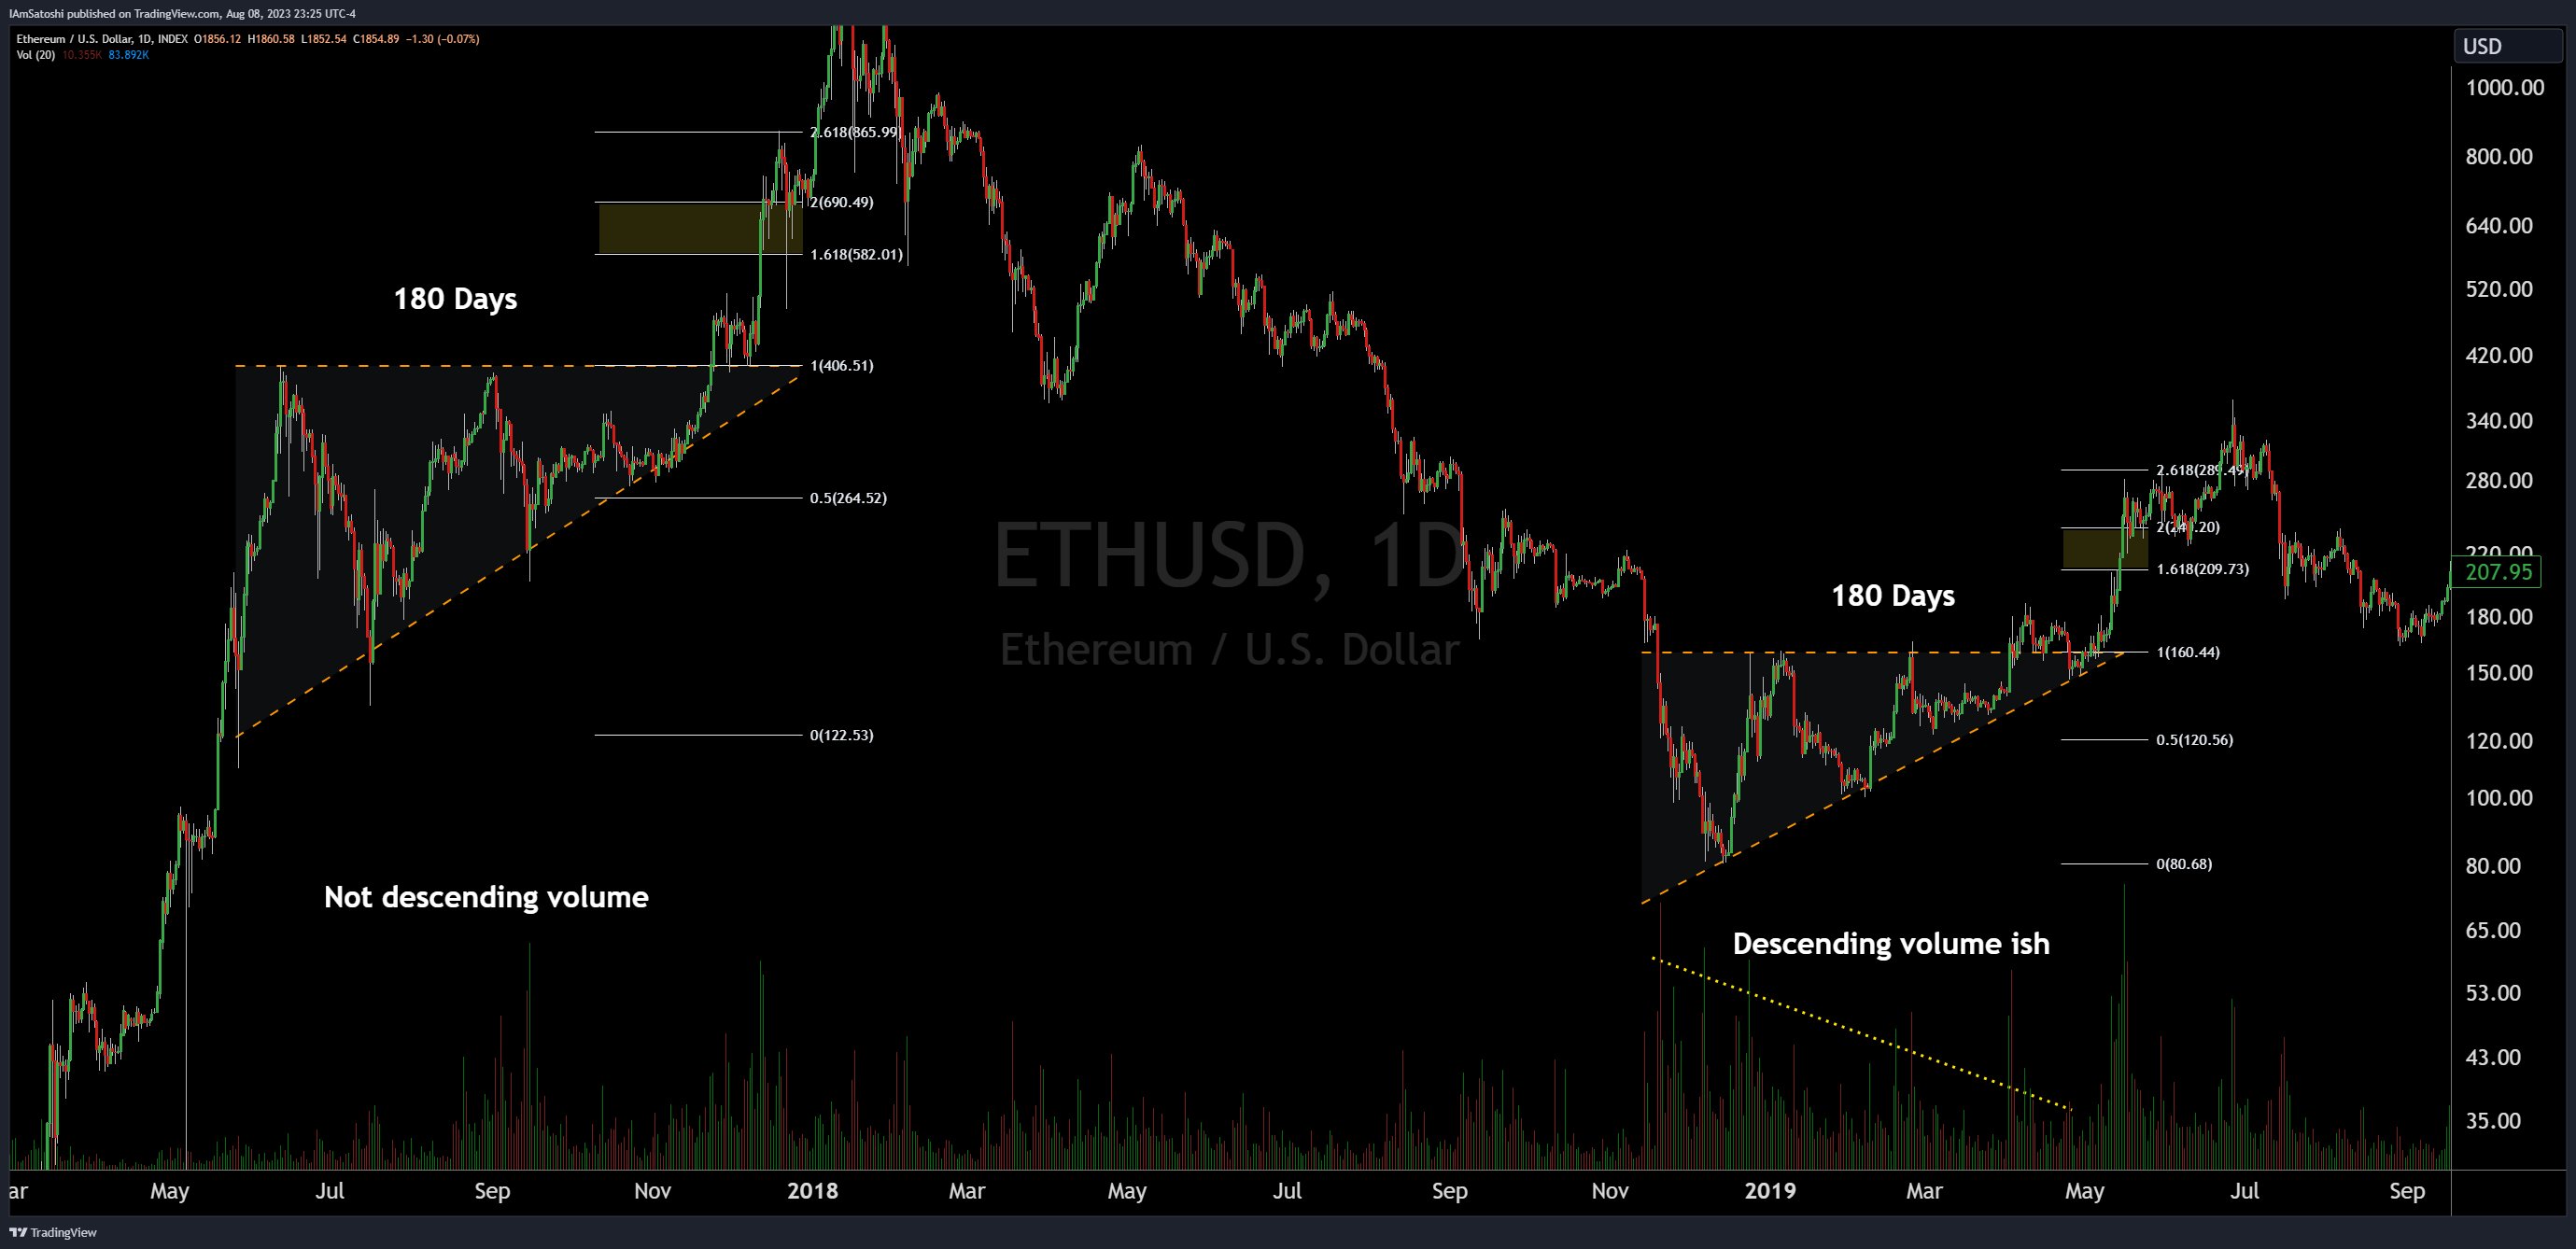
Ethereum ascending triangles in history
History of ascending triangles for ETH | Source: Twitter @CarpeNoctom

Drawing from these historical patterns, Olszewicz suggests that Ethereum is currently holding the potential to overshoot the 1.618 Fibonacci level and possibly reach the 2.618 level, which translates to a price of $3,800. However, he wisely advises, “but don’t get out the imaginary profit calculator just yet, let’s break $2k first.”

See also  XRP price retreats to $1.35 support - But ONE signal points to recovery

ETH vs. BTC: Which One Is The Better Trade?

While Ethereum’s potential rally is intriguing, Olszewicz also delves into its performance relative to Bitcoin. He observes that Ethereum has underperformed Bitcoin year-to-date, attributing this to the ETF narrative and Bitcoin’s dominance as hard money. He speculates, “the better trade may continue to be BTC/USD, especially with initial spot ETF inflows favoring BTC.”

However, if the ETH/BTC pair can break and sustain new highs, it might hint at a runaway trade for Ethereum. But Olszewicz remains skeptical, stating it’s “unlikely based on ETF flows.”

Olszewicz also doesn’t shy away from discussing potential bearish scenarios. He’s closely watching certain bearish ETH/BTC levels, including the current local low at 0.050 and the previous inverse head and shoulders neckline at 0.039.
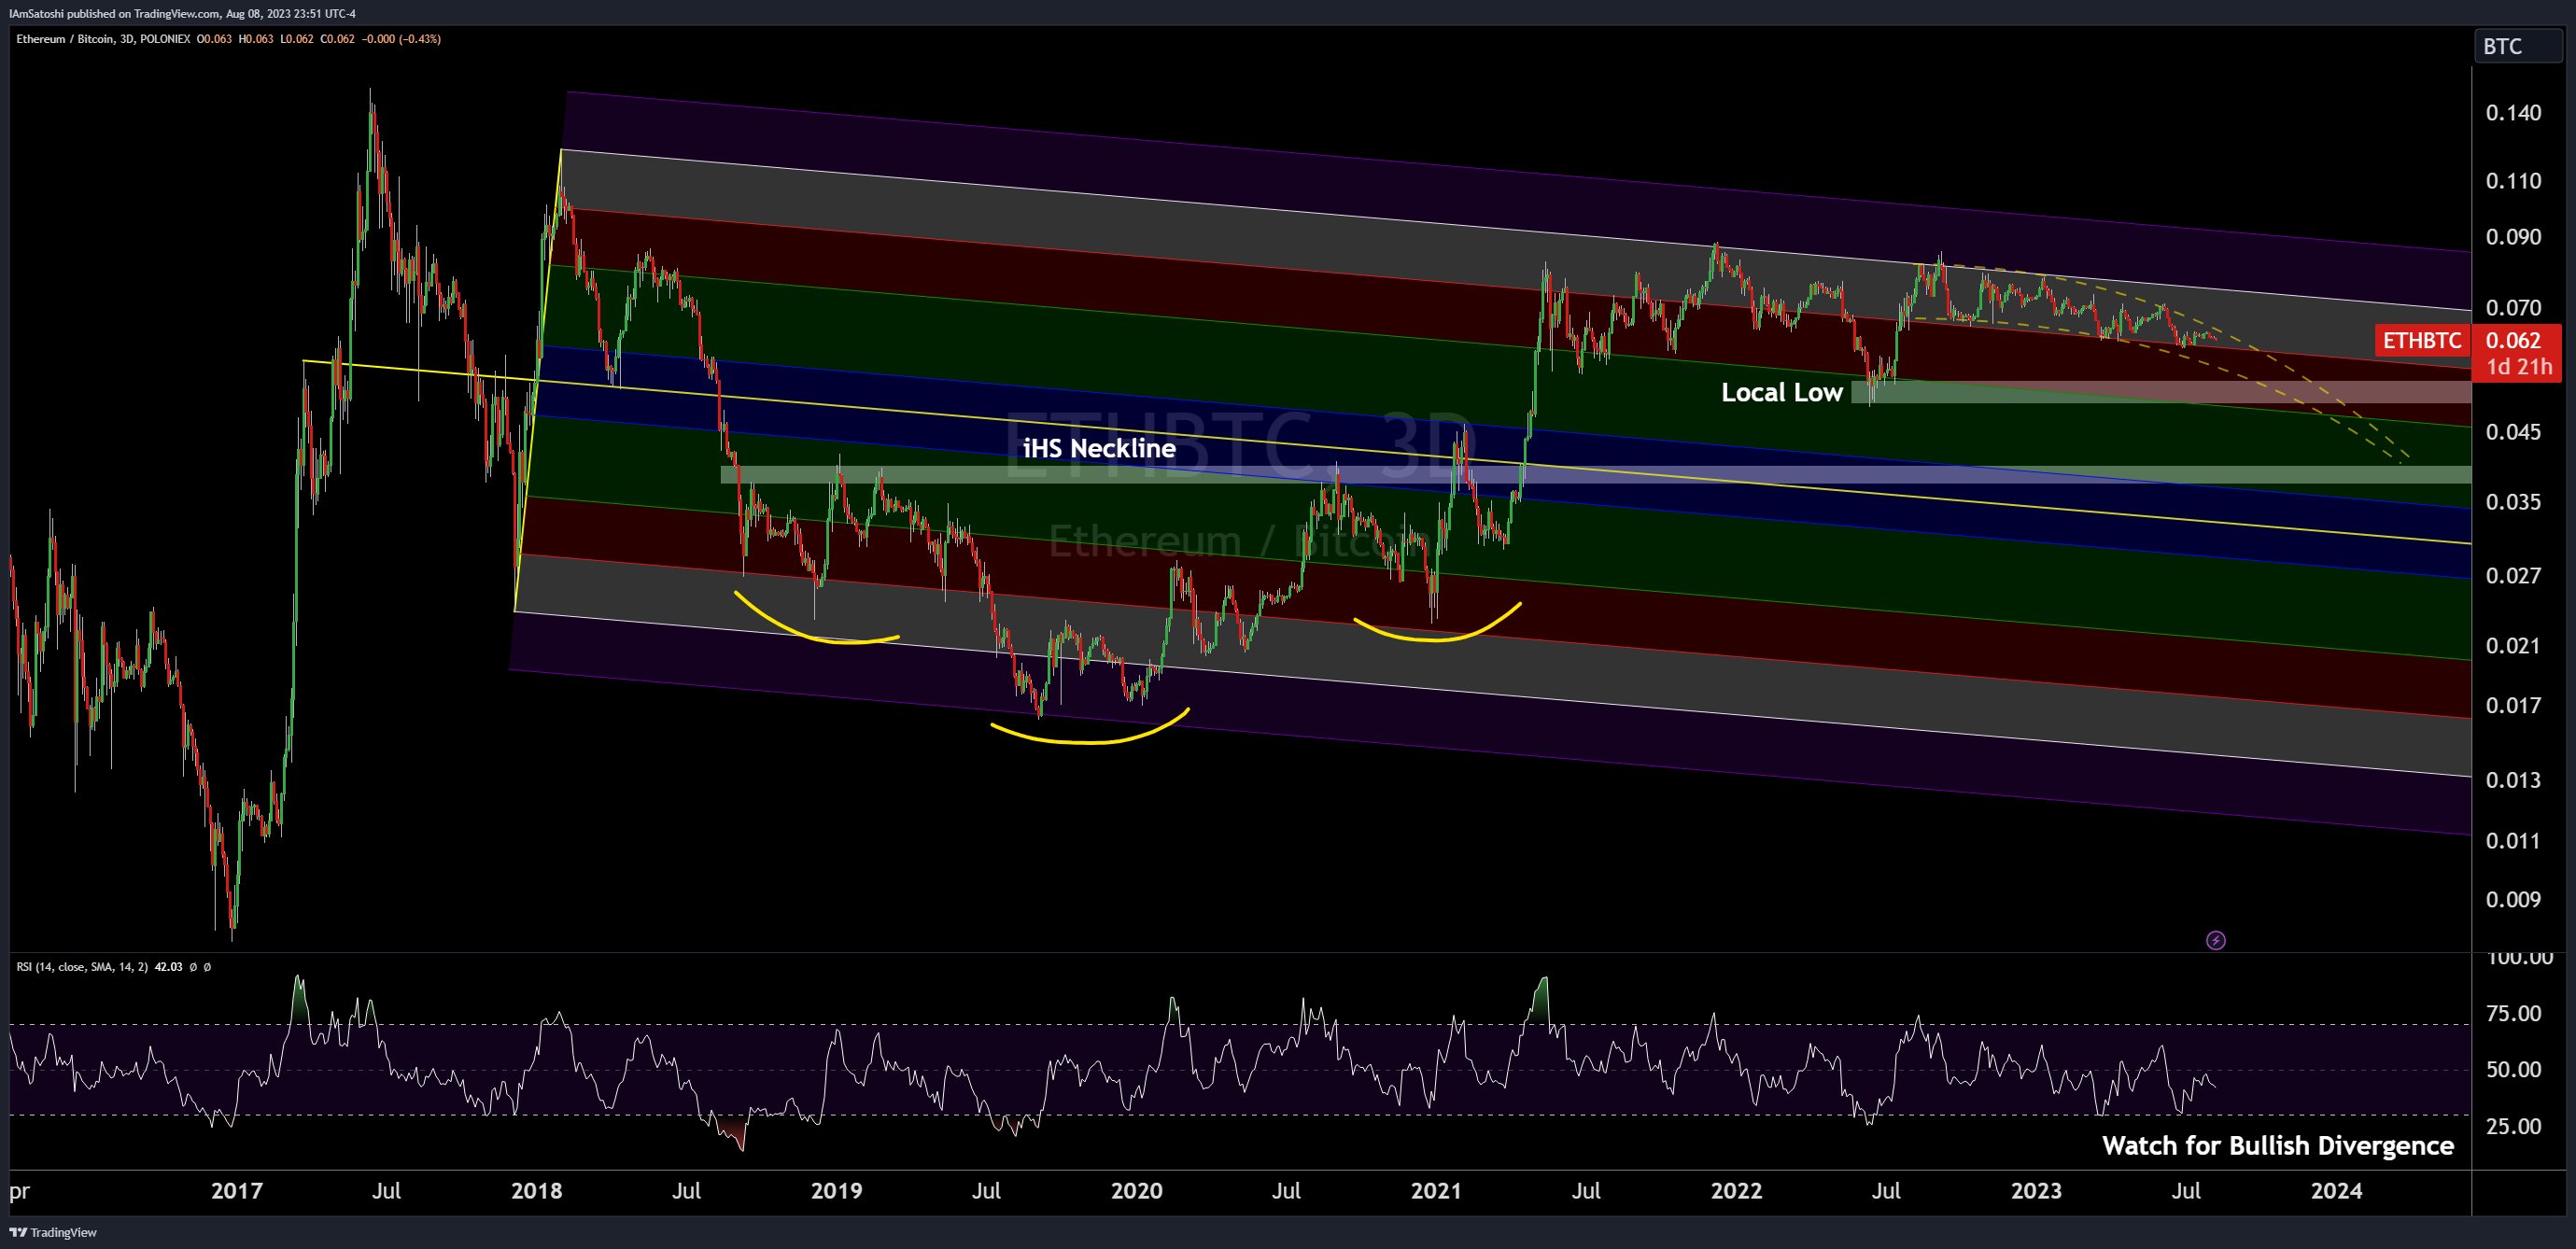
Bearish ETH/BTC levels
Bearish ETH/BTC levels | Source: Twitter @CarpeNoctom

For Bitcoin, he suggests a potential move to $42,000, provided it maintains certain bullish conditions. He notes, “as long as we can maintain prices above the midline of the PF & stay in the cloud, we have a decent shot at reaching $42k before halving.”

Wrapping up his analysis, Olszewicz envisions a dream trade where Bitcoin breaks bullish first, possibly due to technicals or a spot ETF approval. In this scenario, Ethereum breaks $2,000 but lags behind Bitcoin, leading to ETH/BTC getting “crushed, allowing for an eventual profit taking rotation from Bitcoin to Ethereum”. However, he concludes with a word of caution: “without inflows, we ain’t movin.”

At press time, ETH traded at $1,860.
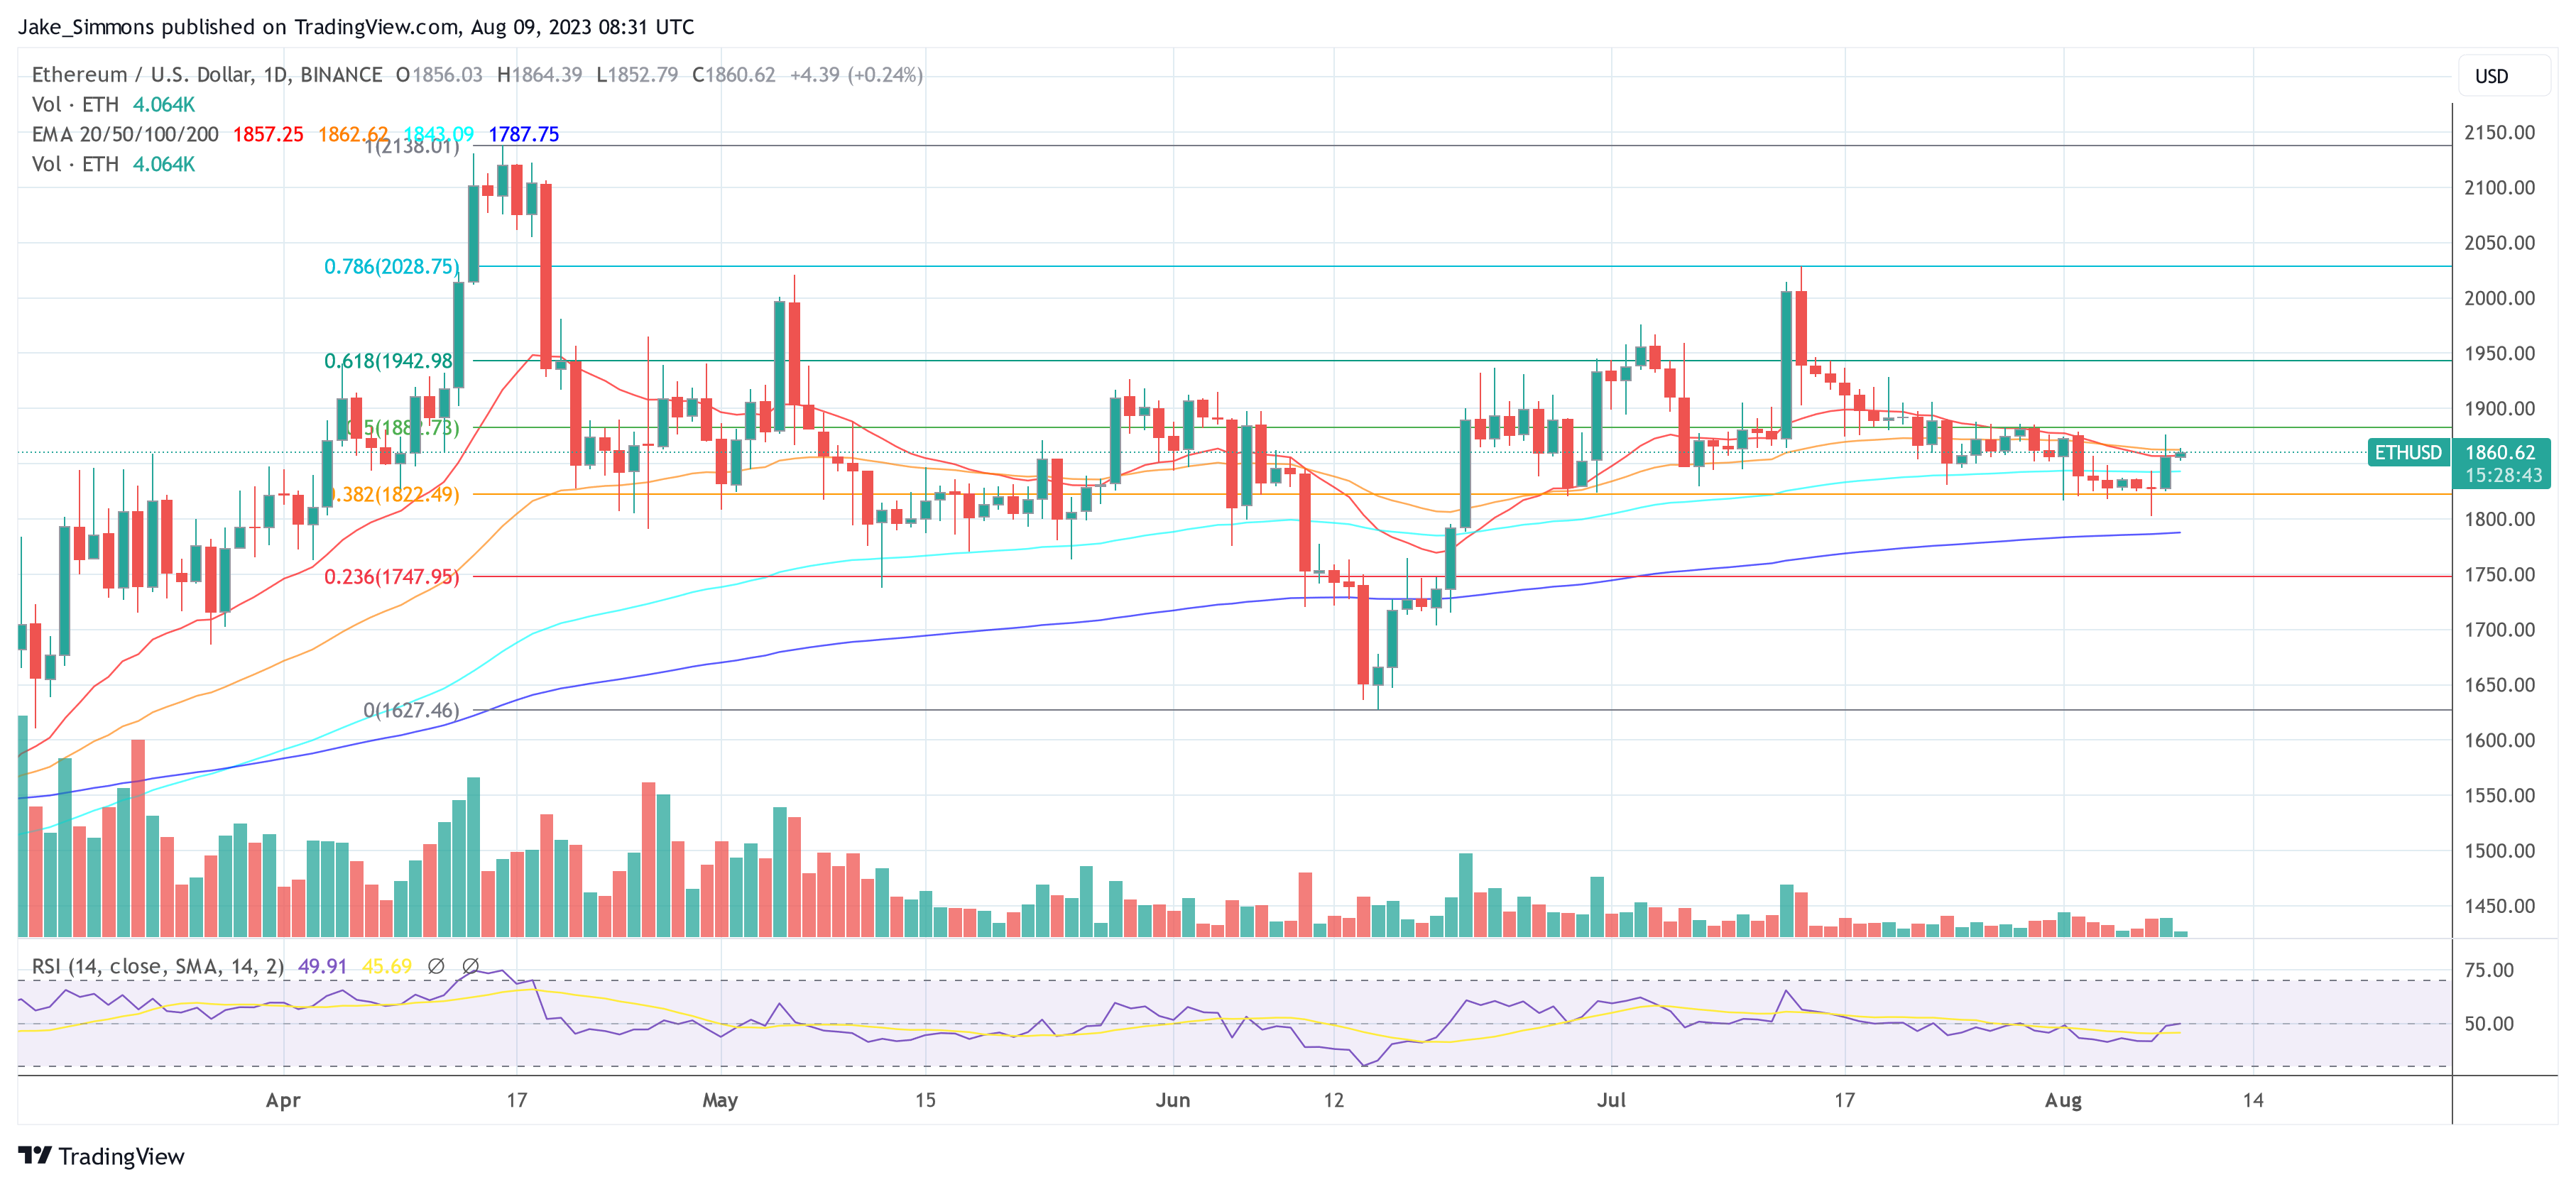
Ethereum price
ETH remains in a lull, 1-day chart | Source ETHUSD on TradingView.com

Featured image from iStock, chart from TradingView.com


Source link

Coming Historical months Playbook points
Share. Facebook Twitter Pinterest LinkedIn Tumblr Email

Related Posts

Why Venice Token’s 11% price drop could push VVV toward $10

July 29, 2026

Audiera loses KEY support – Can BEAT recover from a 24% crash?

July 29, 2026

XPL crypto price prediction 2030: Can Plasma adoption outpace token dilution?

July 28, 2026

Zama’s Q2 update triggers 20% volume surge: But THIS warns of a correction

July 28, 2026
Add A Comment
Leave A Reply Cancel Reply

Top Posts

EDGE explodes 20% – Open Interest jumps as $0.50 liquidity calls

June 14, 2026

Aptos Teams Up With Japanese QR Payment Leader Netstars for Stablecoin and Web3 Apps

May 10, 2026

Buying Cardano Now Is Like Buying Bitcoin Before It Blew Up, Analyst Says

April 3, 2026

Subscribe to Updates

Get the latest creative news From Crypto Daily Pulse directly in your Inbox!

Our mission is to develop a community of people who try to make financially sound decisions. The website strives to educate individuals in making wise choices about Crypto, ICOs, Web3, Blockchain and more.

We're social. Connect with us:

Facebook X (Twitter) Instagram Pinterest YouTube
Top Insights

Why Venice Token’s 11% price drop could push VVV toward $10

July 29, 2026

Galaxy Buys Second Texas Site for AI Data Centre, Shares Pare Early Gain

July 29, 2026

Why Brazil’s Booming Crypto Market Needs Urgent Oversight

July 29, 2026
Get Informed

Subscribe to Updates

Get the latest creative news From Crypto Daily Pulse directly in your Inbox!

  • Contact
  • Privacy Policy
  • Terms & Conditions
© 2026 Crypto Pulse Daily - All rights reserved.

Type above and press Enter to search. Press Esc to cancel.

Cleantalk Pixel
  • bitcoinBitcoin(BTC)$63,730.000.80%
  • ethereumEthereum(ETH)$1,893.400.90%
  • tetherTether(USDT)$1.000.00%
  • binancecoinBNB(BNB)$566.890.30%
  • usd-coinUSDC(USDC)$1.000.00%
  • rippleXRP(XRP)$1.071.30%
  • solanaSolana(SOL)$73.11-0.40%
  • tronTRON(TRX)$0.3246670.20%
  • Figure HelocFigure Heloc(FIGR_HELOC)$1.00-3.00%
  • whitebitWhiteBIT Coin(WBT)$55.740.90%