Close Menu
  • Latest News
    • Market
    • Altcoins
    • Legal and Regulatory
  • Tech
    • Blockchain
    • Security and Privacy
  • Web 3
    • Web3 News
    • NFTs
    • Gaming
  • Learn
    • Education
    • Investments
    • Staking
    • Wallets and Exchanges
  • ICOs
  • Mining
  • Crypto Tools
    • Exchange Tool
  • Shop
What's Hot

Stand With Crypto Advances GENIUS Act Implementation

October 23, 2026

NeoRedPill launches Telegram wallet bot with Neo N3 wallets, cross-chain bridging

October 23, 2026

Can THIS recent update, hike in network activity sustain PUMP’s price rally?

October 23, 2026
Facebook X (Twitter) Instagram
  • Contact
  • Privacy Policy
  • Terms & Conditions
Facebook X (Twitter) Instagram
CryptoPulseDaily.com
  • Latest News
    • Market
    • Altcoins
    • Legal and Regulatory
  • Tech
    • Blockchain
    • Security and Privacy
  • Web 3
    • Web3 News
    • NFTs
    • Gaming
  • Learn
    • Education
    • Investments
    • Staking
    • Wallets and Exchanges
  • ICOs
  • Mining
  • Crypto Tools
    • Exchange Tool
  • Shop
CryptoPulseDaily.com
Home»Altcoins»How did PYTH’s price fall for bears’ trap after latest surge?
Altcoins

How did PYTH’s price fall for bears’ trap after latest surge?

October 22, 2026No Comments3 Mins Read
Share
Facebook Twitter LinkedIn Pinterest Email

Pyth Network [PYTH] has seen a massive surge in activity lately, with the asset recording double-digit percentage gains in price. This wasn’t to last, however, as at press time, PYTH had declined again.

In fact, chart analysis showed that there may be a risk of a further decline, and traders might need to cool their optimism.

PYTH faces key resistance

PYTH recorded a major price swing on the charts recently. However, that bullish run came to an end soon after after the asset started trading in the middle band of the Bollinger Bands.

Bollinger Bands help traders assess whether an asset is overvalued or undervalued by tracking its price relative to the upper and lower bands. The middle band tends to act as a support or resistance level, depending on several factors, such as momentum and price trends.
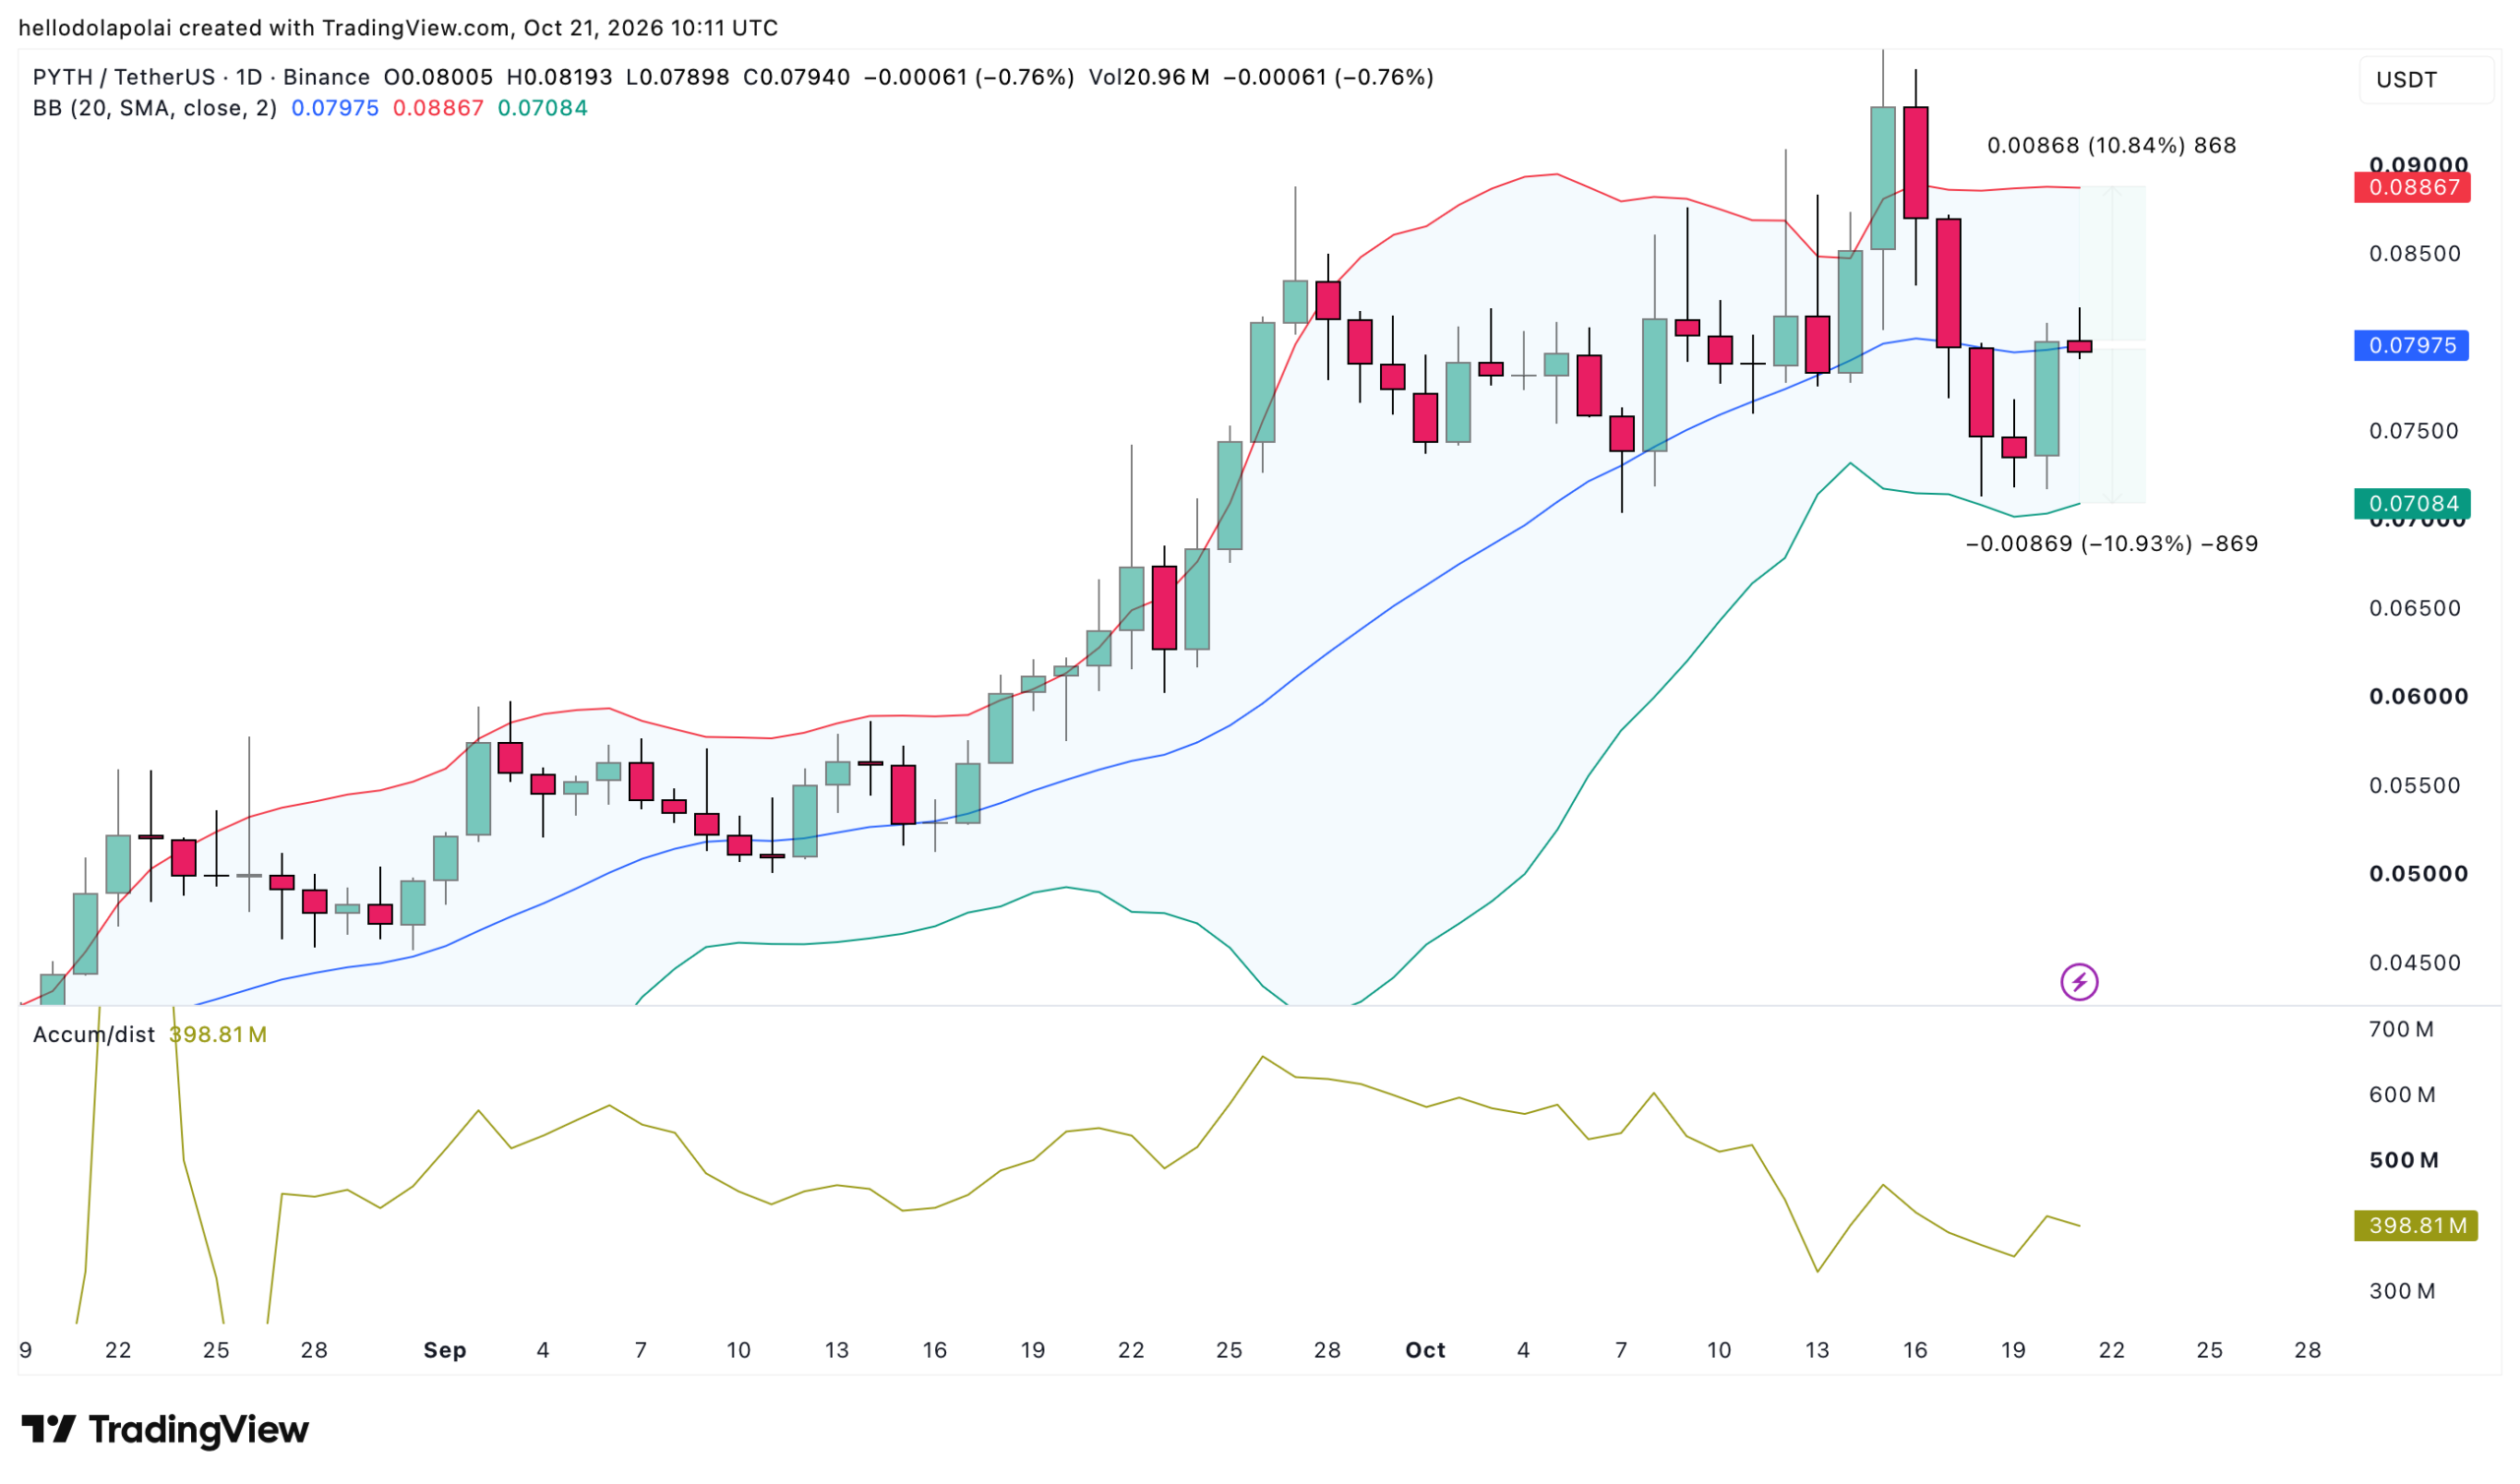
Bollinger Band and Accumulation/Distribution chart.Bollinger Band and Accumulation/Distribution chart.
Source: TradingView

At the time of writing, the price had hit this middle band level at $0.079. It seemed to be acting as resistance and pushing the price slightly lower. A rejection at this zone would see the price fall to around $0.070, marking a 10% drop from its press time level.

Additionally, the Accumulation/Distribution indicator, a volume-weighted tool, suggested that the price could decline further as the indicator ticked lower on the chart.

A look at the bearish signals

Other indicators also suggested that the asset may be losing momentum, while revealing a weakening investor outlook. For instance, the Parabolic Stop and Reverse (SAR) confirmed that bearish pressure on the price was building.
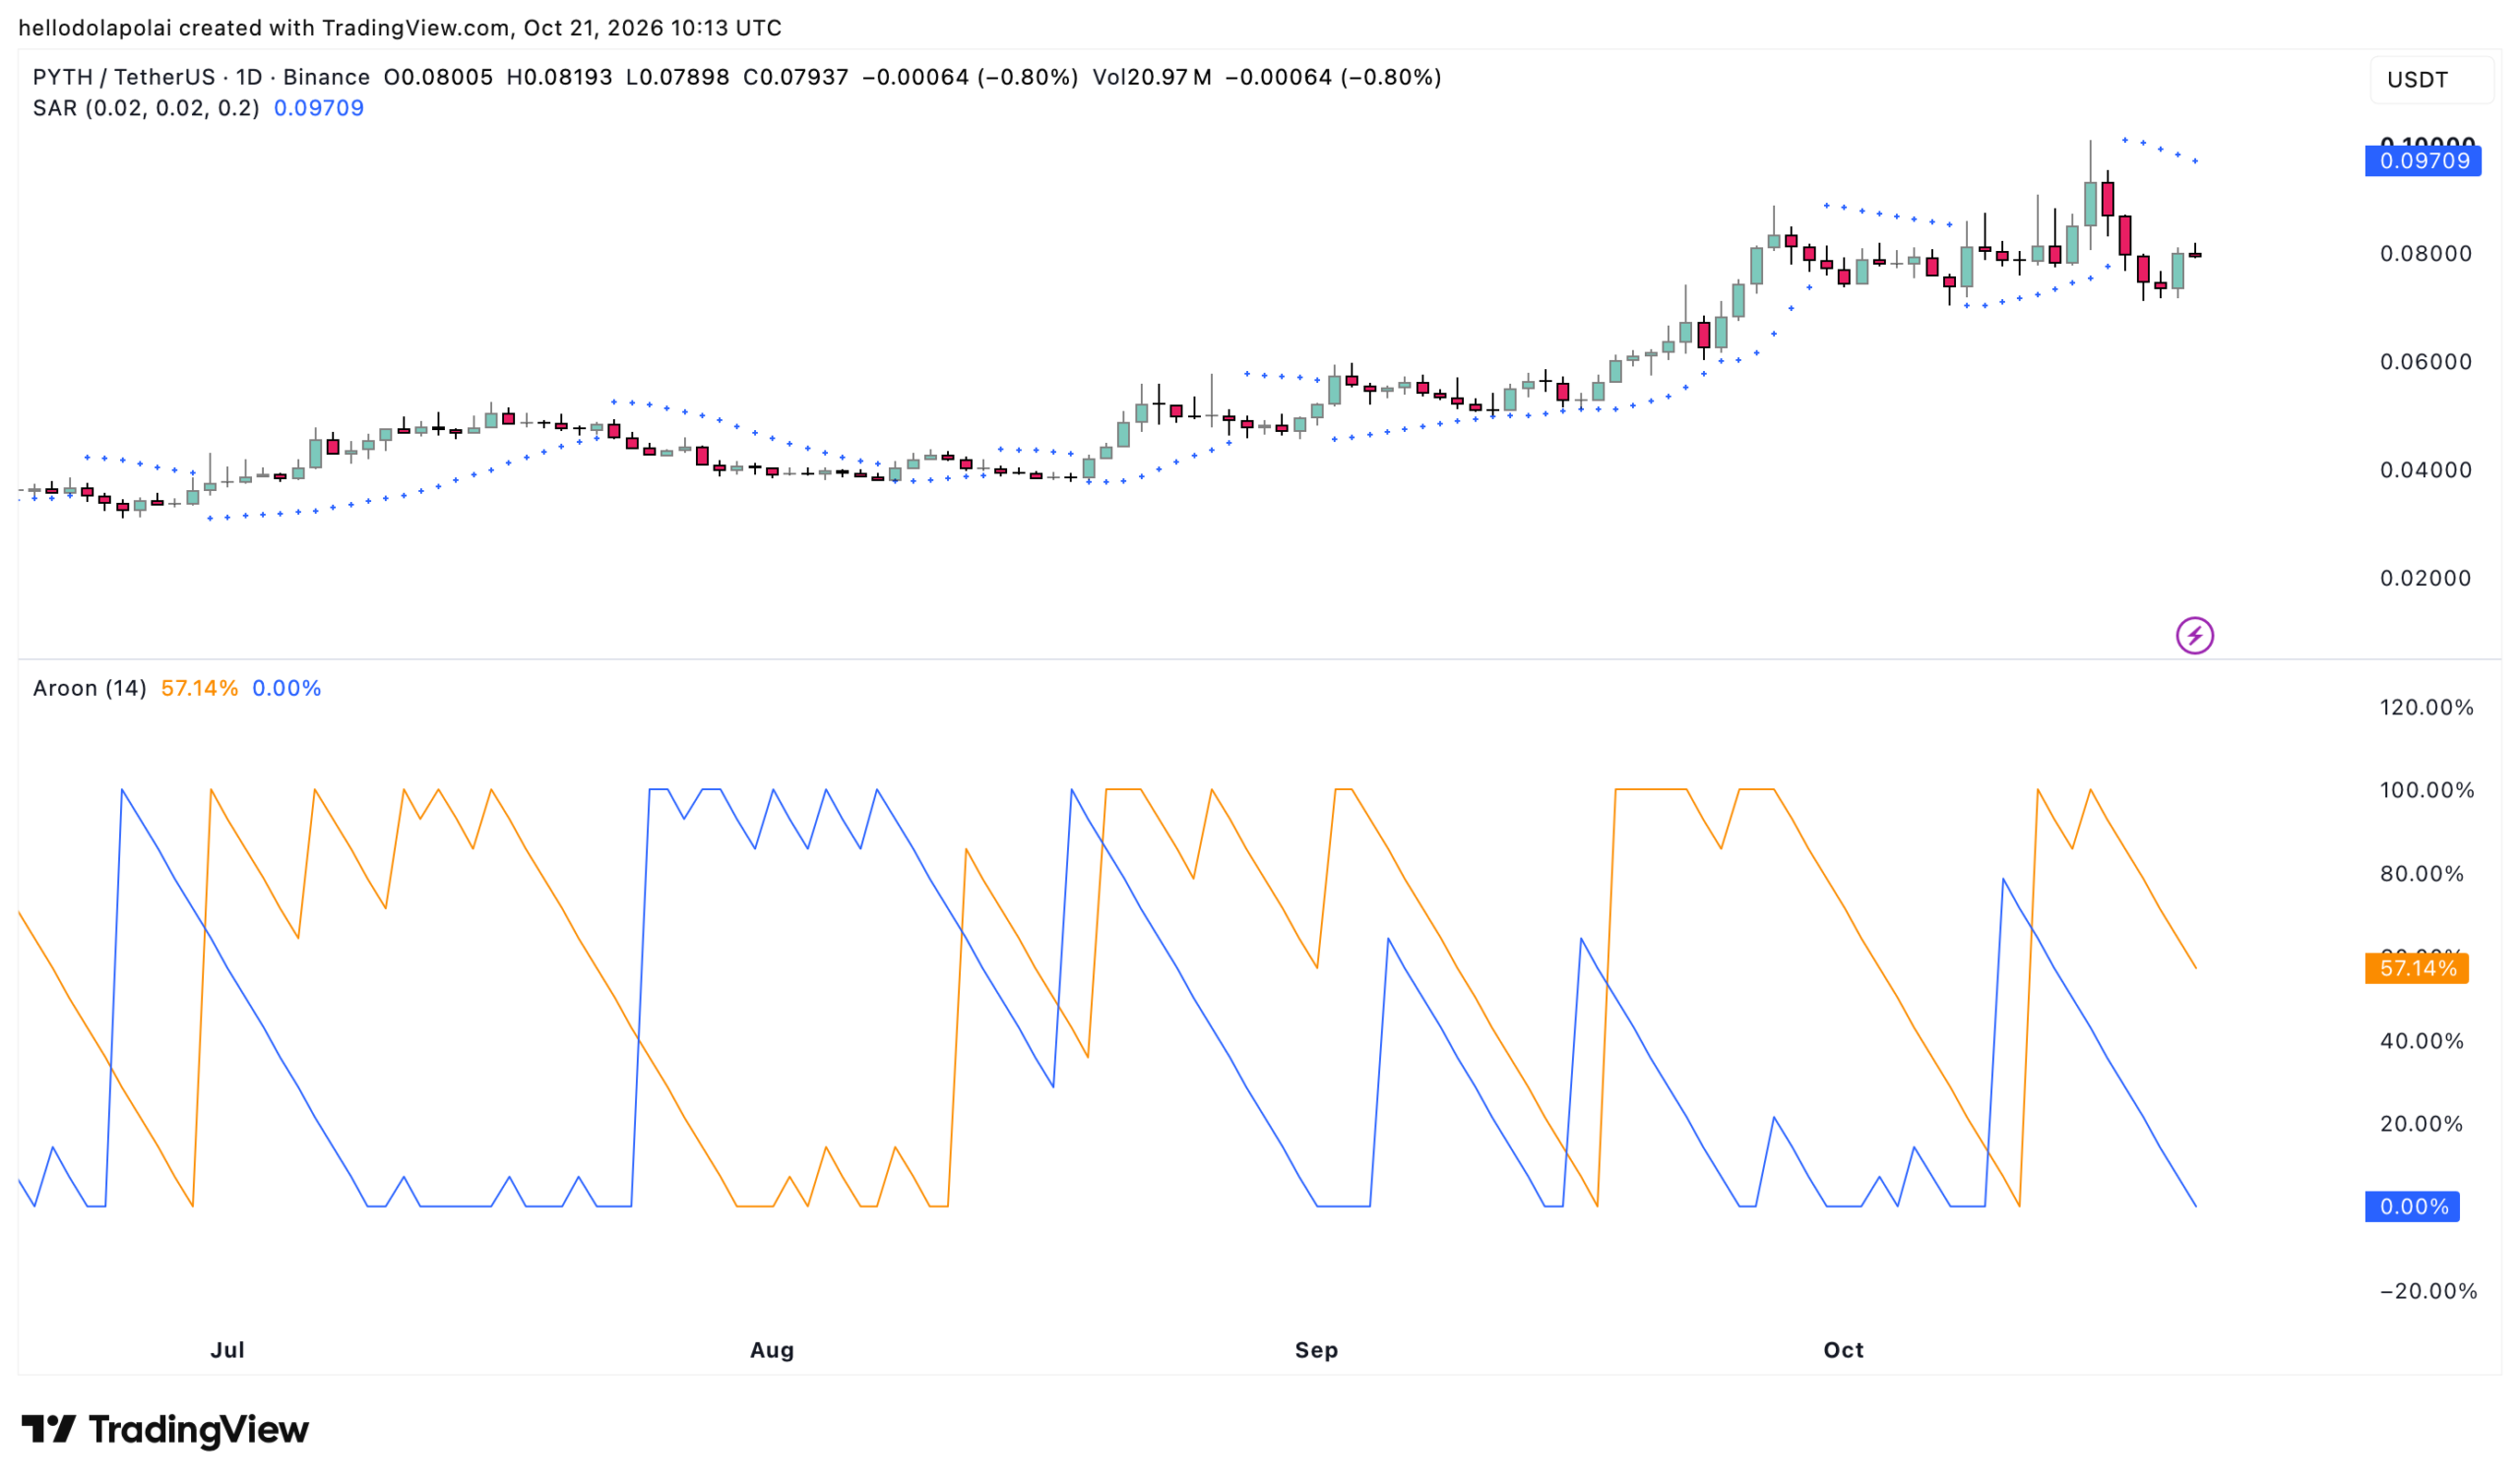
Aroon indicator and parabolic SAR.Aroon indicator and parabolic SAR.
Source: TradingView

The Aroon Indicator corroborated this outlook, although it still showed that the price was well within the bulls’ control. Typically, when the Aroon Up (orange) is above the Aroon Down (blue), with readings of 100.00% and 0.00%, respectively, it alludes to a clearly bullish market scenario.

See also  What's Next for Bitcoin Price (BTC) After Mt. Gox News

However, the Aroon Up line has continued to decline, dropping to 57.14%, while the Aroon Down line remained at 0.00%. This type of move suggested that selling pressure has been building in the market.

Based on this, the possibility of a decline cannot be ruled out. However, it may be a corrective phase ahead of a much stronger rally.

Traders reduce PYTH exposure

Finally, perpetual market traders have been gradually reducing their exposure to PYTH despite its surge. Especially as long positions in the market have fallen across the board.

Coinglass data revealed that the funding rate dropped from 0.0038% to 0.0016%, a decline of more than 50%. This happened while the total capital in PYTH’s perpetual contracts rose by 3.95% to $54 million.
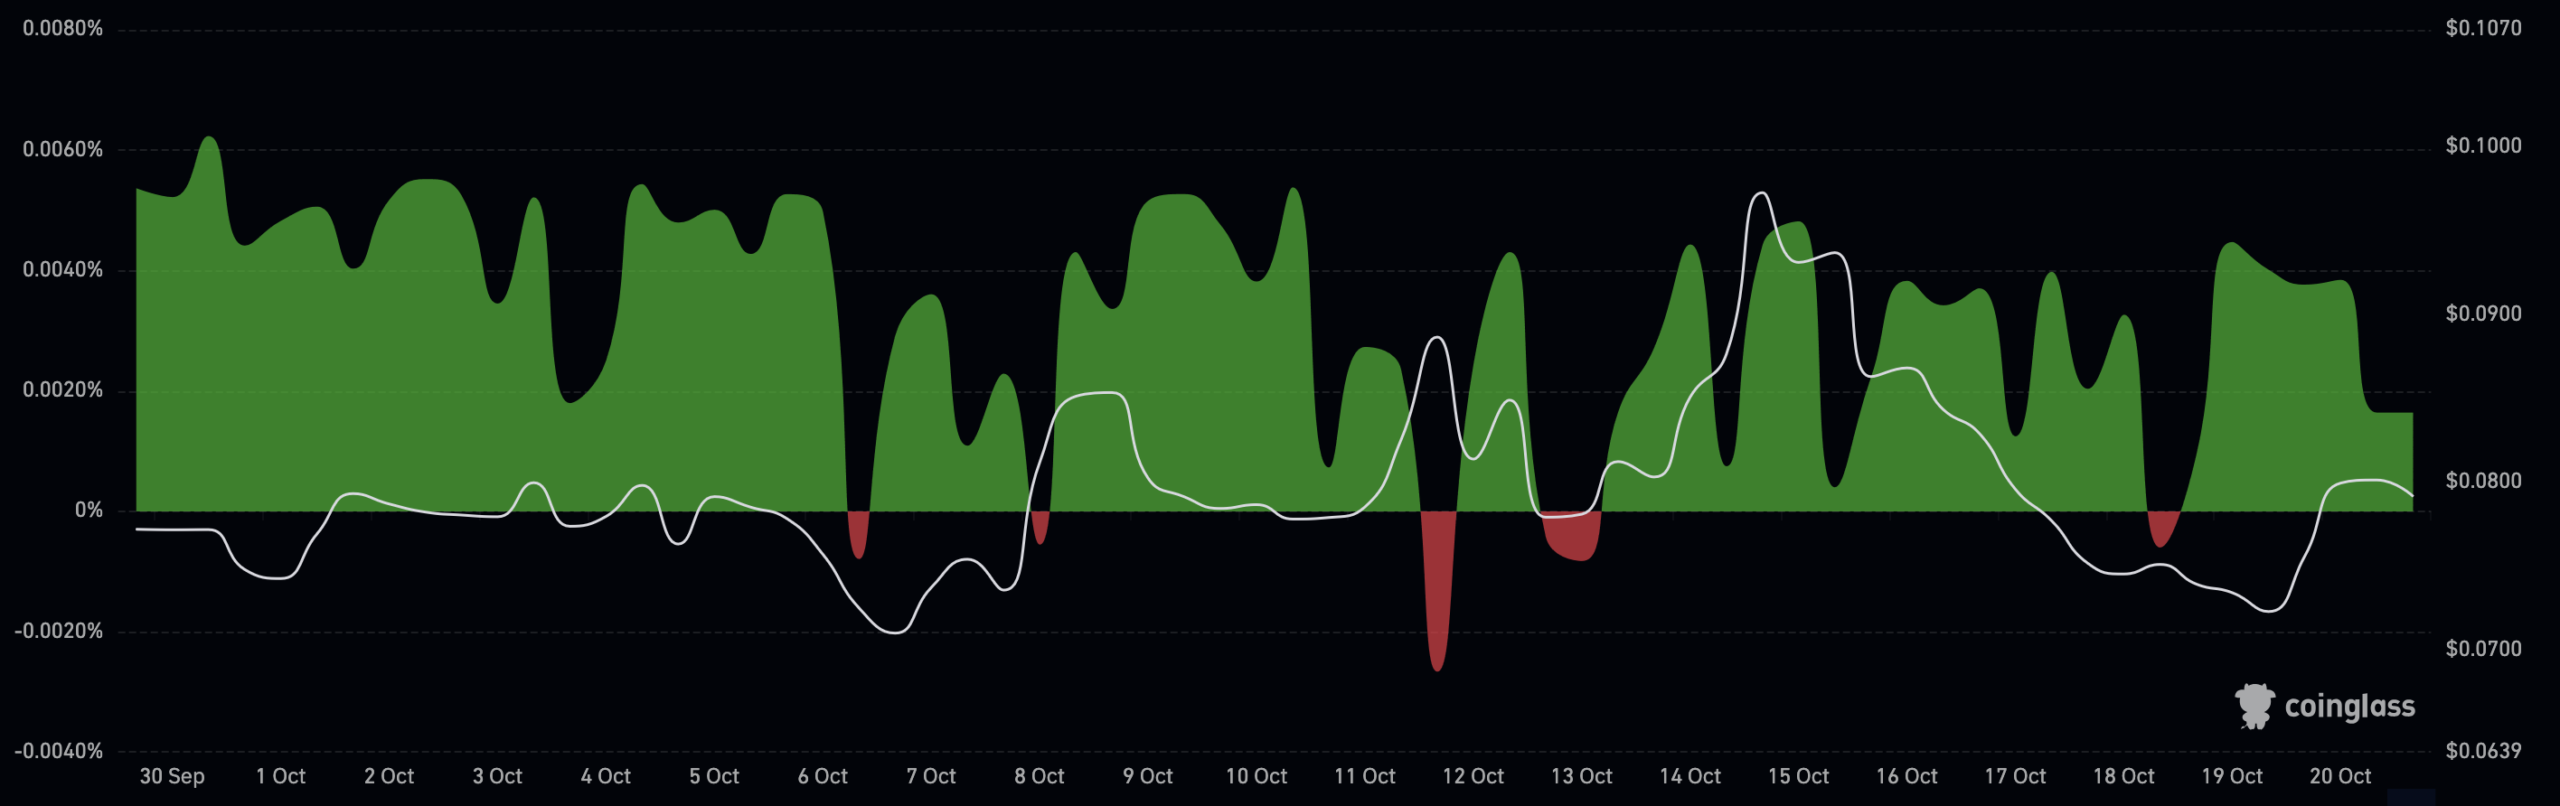
PYTH funding rate chart.PYTH funding rate chart.
Source: CoinGlass

This implied that while a majority of the capital in the perpetual market has been in long positions, the growing number of short positions may be a risk that traders should be cautious of.


Final Summary

  • PYTH’s resistance at $0.079 and a declining Accumulation/Distribution hinted at a price correction.
  • PYTH’s funding rate fell by over 50% to 0.0016%, while perpetual market capital rose 3.95% to $54 million.


Source link

Bears Fall Latest Price Pyths surge Trap
Share. Facebook Twitter Pinterest LinkedIn Tumblr Email

Related Posts

Can THIS recent update, hike in network activity sustain PUMP’s price rally?

October 23, 2026

Zcash Foundation Details Zebra Sync Fixes Ahead Of NU7 Release

October 23, 2026

PROM’s rally has a catch – And it’s hiding in the Spot market

October 23, 2026

Why is Lighter under $4 despite buybacks, CFTC filings, and $1.64B OI?

October 22, 2026
Add A Comment
Leave A Reply Cancel Reply

Top Posts

Dogecoin Cools Near Support As Meme Traders Wait For A Cleaner Breakout Signal

July 13, 2026

Bitcoin miners’ real prize is power as AI reshapes mining

May 29, 2026

How to Earn Cryptocurrency Through Gaming

November 21, 2024

Subscribe to Updates

Get the latest creative news From Crypto Daily Pulse directly in your Inbox!

Our mission is to develop a community of people who try to make financially sound decisions. The website strives to educate individuals in making wise choices about Crypto, ICOs, Web3, Blockchain and more.

We're social. Connect with us:

Facebook X (Twitter) Instagram Pinterest YouTube
Top Insights

Stand With Crypto Advances GENIUS Act Implementation

October 23, 2026

NeoRedPill launches Telegram wallet bot with Neo N3 wallets, cross-chain bridging

October 23, 2026

Can THIS recent update, hike in network activity sustain PUMP’s price rally?

October 23, 2026
Get Informed

Subscribe to Updates

Get the latest creative news From Crypto Daily Pulse directly in your Inbox!

  • Contact
  • Privacy Policy
  • Terms & Conditions
© 2026 Crypto Pulse Daily - All rights reserved.

Type above and press Enter to search. Press Esc to cancel.

Cleantalk Pixel
  • bitcoinBitcoin(BTC)$81,498.00-0.27%
  • ethereumEthereum(ETH)$2,393.09-0.21%
  • tetherTether(USDT)$1.00-0.01%
  • binancecoinBNB(BNB)$743.521.45%
  • rippleXRP(XRP)$1.32-0.61%
  • usd-coinUSDC(USDC)$1.00-0.01%
  • solanaSolana(SOL)$103.860.15%
  • tronTRON(TRX)$0.329134-0.39%
  • Figure HelocFigure Heloc(FIGR_HELOC)$1.030.00%
  • zcashZcash(ZEC)$1,217.56-1.73%