Close Menu
  • Latest News
    • Market
    • Altcoins
    • Legal and Regulatory
  • Tech
    • Blockchain
    • Security and Privacy
  • Web 3
    • Web3 News
    • NFTs
    • Gaming
  • Learn
    • Education
    • Investments
    • Staking
    • Wallets and Exchanges
  • ICOs
  • Mining
  • Crypto Tools
    • Exchange Tool
  • Shop
What's Hot

SEC plan to scrap ‘Rule 611’ a boon for tokenized US stocks: Galaxy

June 14, 2026

VanEck Highlights BNB Chain Usage To Differentiate VBNB ETF

June 14, 2026

SpaceCoin launches satellite IoT proof of concept with South Africa’s BCX

June 14, 2026
Facebook X (Twitter) Instagram
  • Contact
  • Privacy Policy
  • Terms & Conditions
Facebook X (Twitter) Instagram
CryptoPulseDaily.com
  • Latest News
    • Market
    • Altcoins
    • Legal and Regulatory
  • Tech
    • Blockchain
    • Security and Privacy
  • Web 3
    • Web3 News
    • NFTs
    • Gaming
  • Learn
    • Education
    • Investments
    • Staking
    • Wallets and Exchanges
  • ICOs
  • Mining
  • Crypto Tools
    • Exchange Tool
  • Shop
CryptoPulseDaily.com
Home»Market»How Long Will Shiba Inu (SHIB) Price Continue Falling?
Market

How Long Will Shiba Inu (SHIB) Price Continue Falling?

February 2, 2024No Comments2 Mins Read
Share
Facebook Twitter LinkedIn Pinterest Email

Shiba Inu’s (SHIB) price has fallen since December 17, 2023, when a diagonal resistance trend line rejected it.

SHIB trades below a horizontal support area and inside a short-term bearish pattern.

Shiba Inu Consolidates Below Resistance

The technical analysis of the daily time frame shows that SHIB has fallen since the resistance trend line of an ascending parallel channel rejected it on December 17, 2023 (red icon).

After initially bouncing above the $0.0000093 support area, SHIB broke down on January 22. SHIB validated it as resistance (red circle) on January 29 and has fallen since.

SHIB/USDT Daily Chart. Source: TradingView

The daily Relative Strength Index (RSI) is bearish. When evaluating market conditions, traders use the RSI as a momentum indicator to determine whether a market is overbought or oversold and whether to accumulate or sell an asset.

If the RSI reading is above 50 and the trend is upward, bulls still have an advantage, but if the reading is below 50, the opposite is true. The indicator made numerous failed breakout attempts above 50 (red circle) and trades below the level.

Read More: How To Buy Shiba Inu (SHIB) and Everything You Need To Know

SHIB Price Prediction: What’s the Trend’s Direction?

The outlook from the short-term six-hour time frame is similarly bearish. The chart shows that SHIB trades inside a descending triangle considered a bearish pattern. It is approaching the end of the pattern, so a decisive movement is expected soon.

Read More: Shiba Inu Burn Rate Explained: Understanding Token Burning

The six-hour RSI supports the breakdown since it was rejected by the 50 trend line (red icon).

See also  Rough patch for Litecoin? Predictions suggest another price plunge

If SHIB breaks down from the triangle, it can fall 16% to the channel’s support trend line at $0.0000076.

SHIB Price Prediction
SHIB/USDT Six-Hour Chart. Source: TradingView

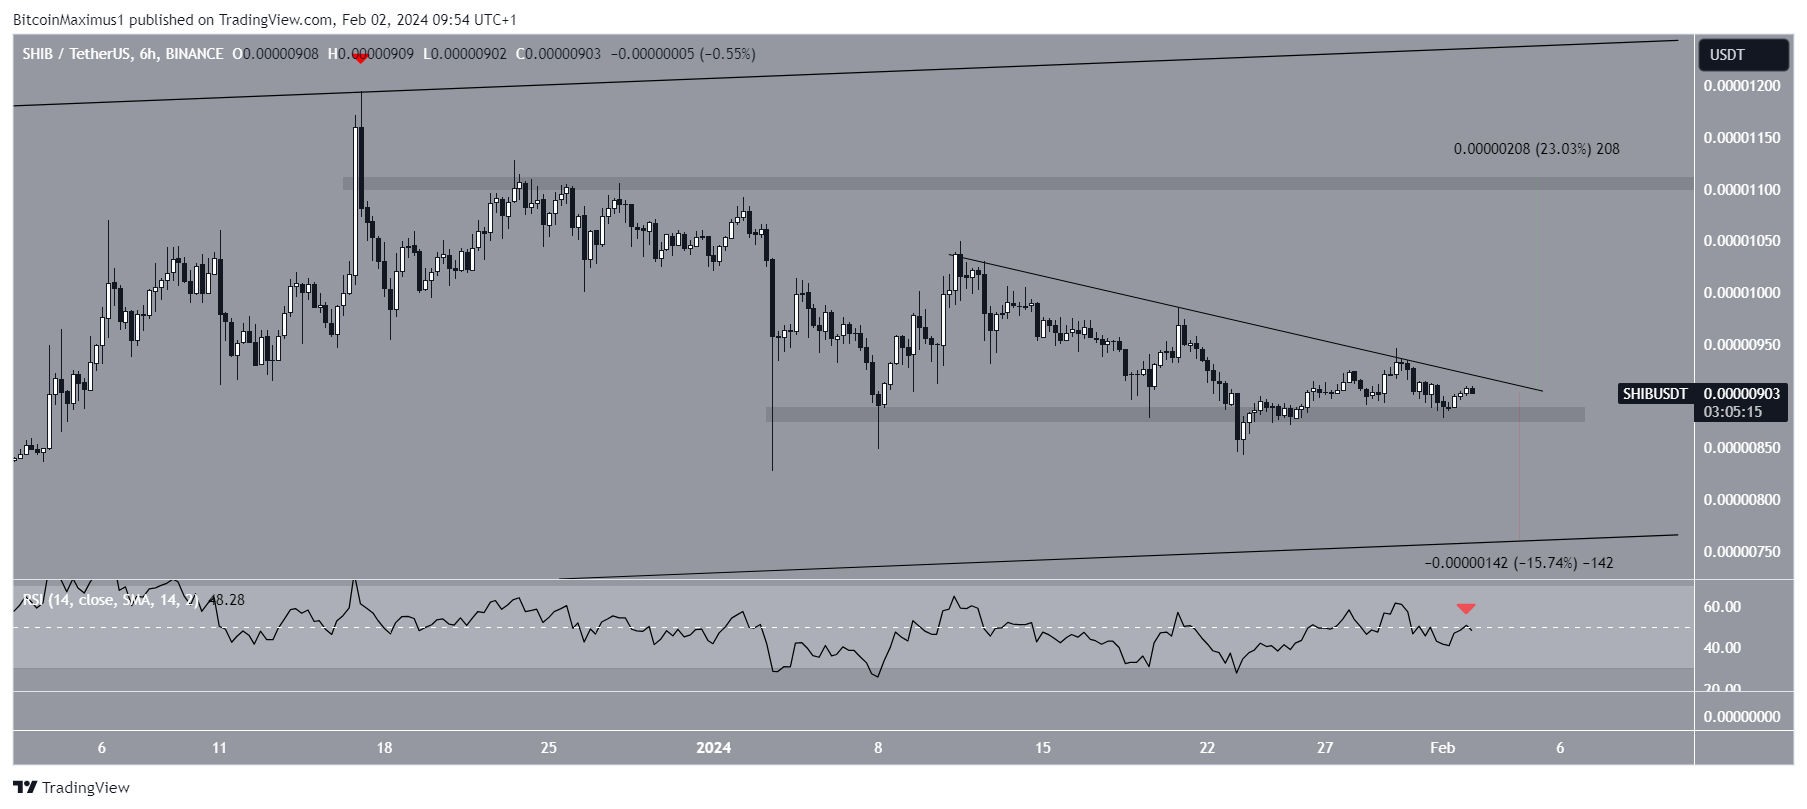
Despite this bearish SHIB price prediction, a breakout from the resistance trend line can trigger a 23% increase to the next resistance at $0.0000110.

For BeInCrypto’s latest crypto market analysis, click here.

Disclaimer

In line with the Trust Project guidelines, this price analysis article is for informational purposes only and should not be considered financial or investment advice. BeInCrypto is committed to accurate, unbiased reporting, but market conditions are subject to change without notice. Always conduct your own research and consult with a professional before making any financial decisions. Please note that our Terms and Conditions, Privacy Policy, and Disclaimers have been updated.

Source link

Continue falling Inu long Price SHIB Shiba
Share. Facebook Twitter Pinterest LinkedIn Tumblr Email

Related Posts

Here’s what SpaceX’s IPO means for its 18,000 bitcoin (BTC) holdings

June 14, 2026

Here’s what Claude Fable 5 means for crypto and DeFi

June 13, 2026

Thanks to you, 25% of ‘Mag8’ firms now hold bitcoin

June 13, 2026

What happens to Satoshi’s BTC when Bitcoin’s quantum problem is fixed?

June 13, 2026
Add A Comment
Leave A Reply Cancel Reply

Top Posts

SEC Chair Gary Gensler Takes Another Swipe at the Crypto Sector, Says Digital Asset Firms Avoid Disclosure Laws

March 23, 2024

Ether’s Prometheum Test

February 9, 2024

68% of global BTC miners came from the U.S., Russia, and China, Q1 2026

April 2, 2026

Subscribe to Updates

Get the latest creative news From Crypto Daily Pulse directly in your Inbox!

Our mission is to develop a community of people who try to make financially sound decisions. The website strives to educate individuals in making wise choices about Crypto, ICOs, Web3, Blockchain and more.

We're social. Connect with us:

Facebook X (Twitter) Instagram Pinterest YouTube
Top Insights

SEC plan to scrap ‘Rule 611’ a boon for tokenized US stocks: Galaxy

June 14, 2026

VanEck Highlights BNB Chain Usage To Differentiate VBNB ETF

June 14, 2026

SpaceCoin launches satellite IoT proof of concept with South Africa’s BCX

June 14, 2026
Get Informed

Subscribe to Updates

Get the latest creative news From Crypto Daily Pulse directly in your Inbox!

  • Contact
  • Privacy Policy
  • Terms & Conditions
© 2026 Crypto Pulse Daily - All rights reserved.

Type above and press Enter to search. Press Esc to cancel.

Cleantalk Pixel
  • bitcoinBitcoin(BTC)$64,234.000.86%
  • ethereumEthereum(ETH)$1,675.560.43%
  • tetherTether(USDT)$1.000.00%
  • binancecoinBNB(BNB)$610.551.37%
  • usd-coinUSDC(USDC)$1.000.00%
  • rippleXRP(XRP)$1.151.01%
  • solanaSolana(SOL)$68.131.72%
  • tronTRON(TRX)$0.3155140.04%
  • Figure HelocFigure Heloc(FIGR_HELOC)$1.02-1.29%
  • dogecoinDogecoin(DOGE)$0.0874390.94%