Close Menu
  • Latest News
    • Market
    • Altcoins
    • Legal and Regulatory
  • Tech
    • Blockchain
    • Security and Privacy
  • Web 3
    • Web3 News
    • NFTs
    • Gaming
  • Learn
    • Education
    • Investments
    • Staking
    • Wallets and Exchanges
  • ICOs
  • Mining
  • Crypto Tools
    • Exchange Tool
  • Shop
What's Hot

‘Under pressure’ Dogecoin down by 40%, but is more downside ahead for memecoin?

November 15, 2026

Supreme Court to decide tax bill for prediction market operators

November 15, 2026

Binance says stolen crypto has been replaced but some customers have to wait

November 15, 2026
Facebook X (Twitter) Instagram
  • Contact
  • Privacy Policy
  • Terms & Conditions
Facebook X (Twitter) Instagram
CryptoPulseDaily.com
  • Latest News
    • Market
    • Altcoins
    • Legal and Regulatory
  • Tech
    • Blockchain
    • Security and Privacy
  • Web 3
    • Web3 News
    • NFTs
    • Gaming
  • Learn
    • Education
    • Investments
    • Staking
    • Wallets and Exchanges
  • ICOs
  • Mining
  • Crypto Tools
    • Exchange Tool
  • Shop
CryptoPulseDaily.com
Home»Altcoins»Kamino Finance [KMNO] gains 17% – Why bulls should watch THIS indicator
Altcoins

Kamino Finance [KMNO] gains 17% – Why bulls should watch THIS indicator

September 26, 2026No Comments3 Mins Read
Share
Facebook Twitter LinkedIn Pinterest Email

Kamino Finance [KMNO] delivered an impressive rally in the past day, with 17% in accrued value during this period. This extends its performance over the past couple of weeks, during which gains surged notably.

Chart analysis using the Bollinger Bands, however, paints a bigger picture, showing that KMNO is now in the overbought territory. That’s the upper Bollinger Band line in red.

The overbought region on the chart implies that there’s a high risk of a decline when price trades into this zone, as traders are paying more than the asset’s fair value. In the past four instances where price had traded into the upper band, there had been a decline to the mid-band level, in blue.
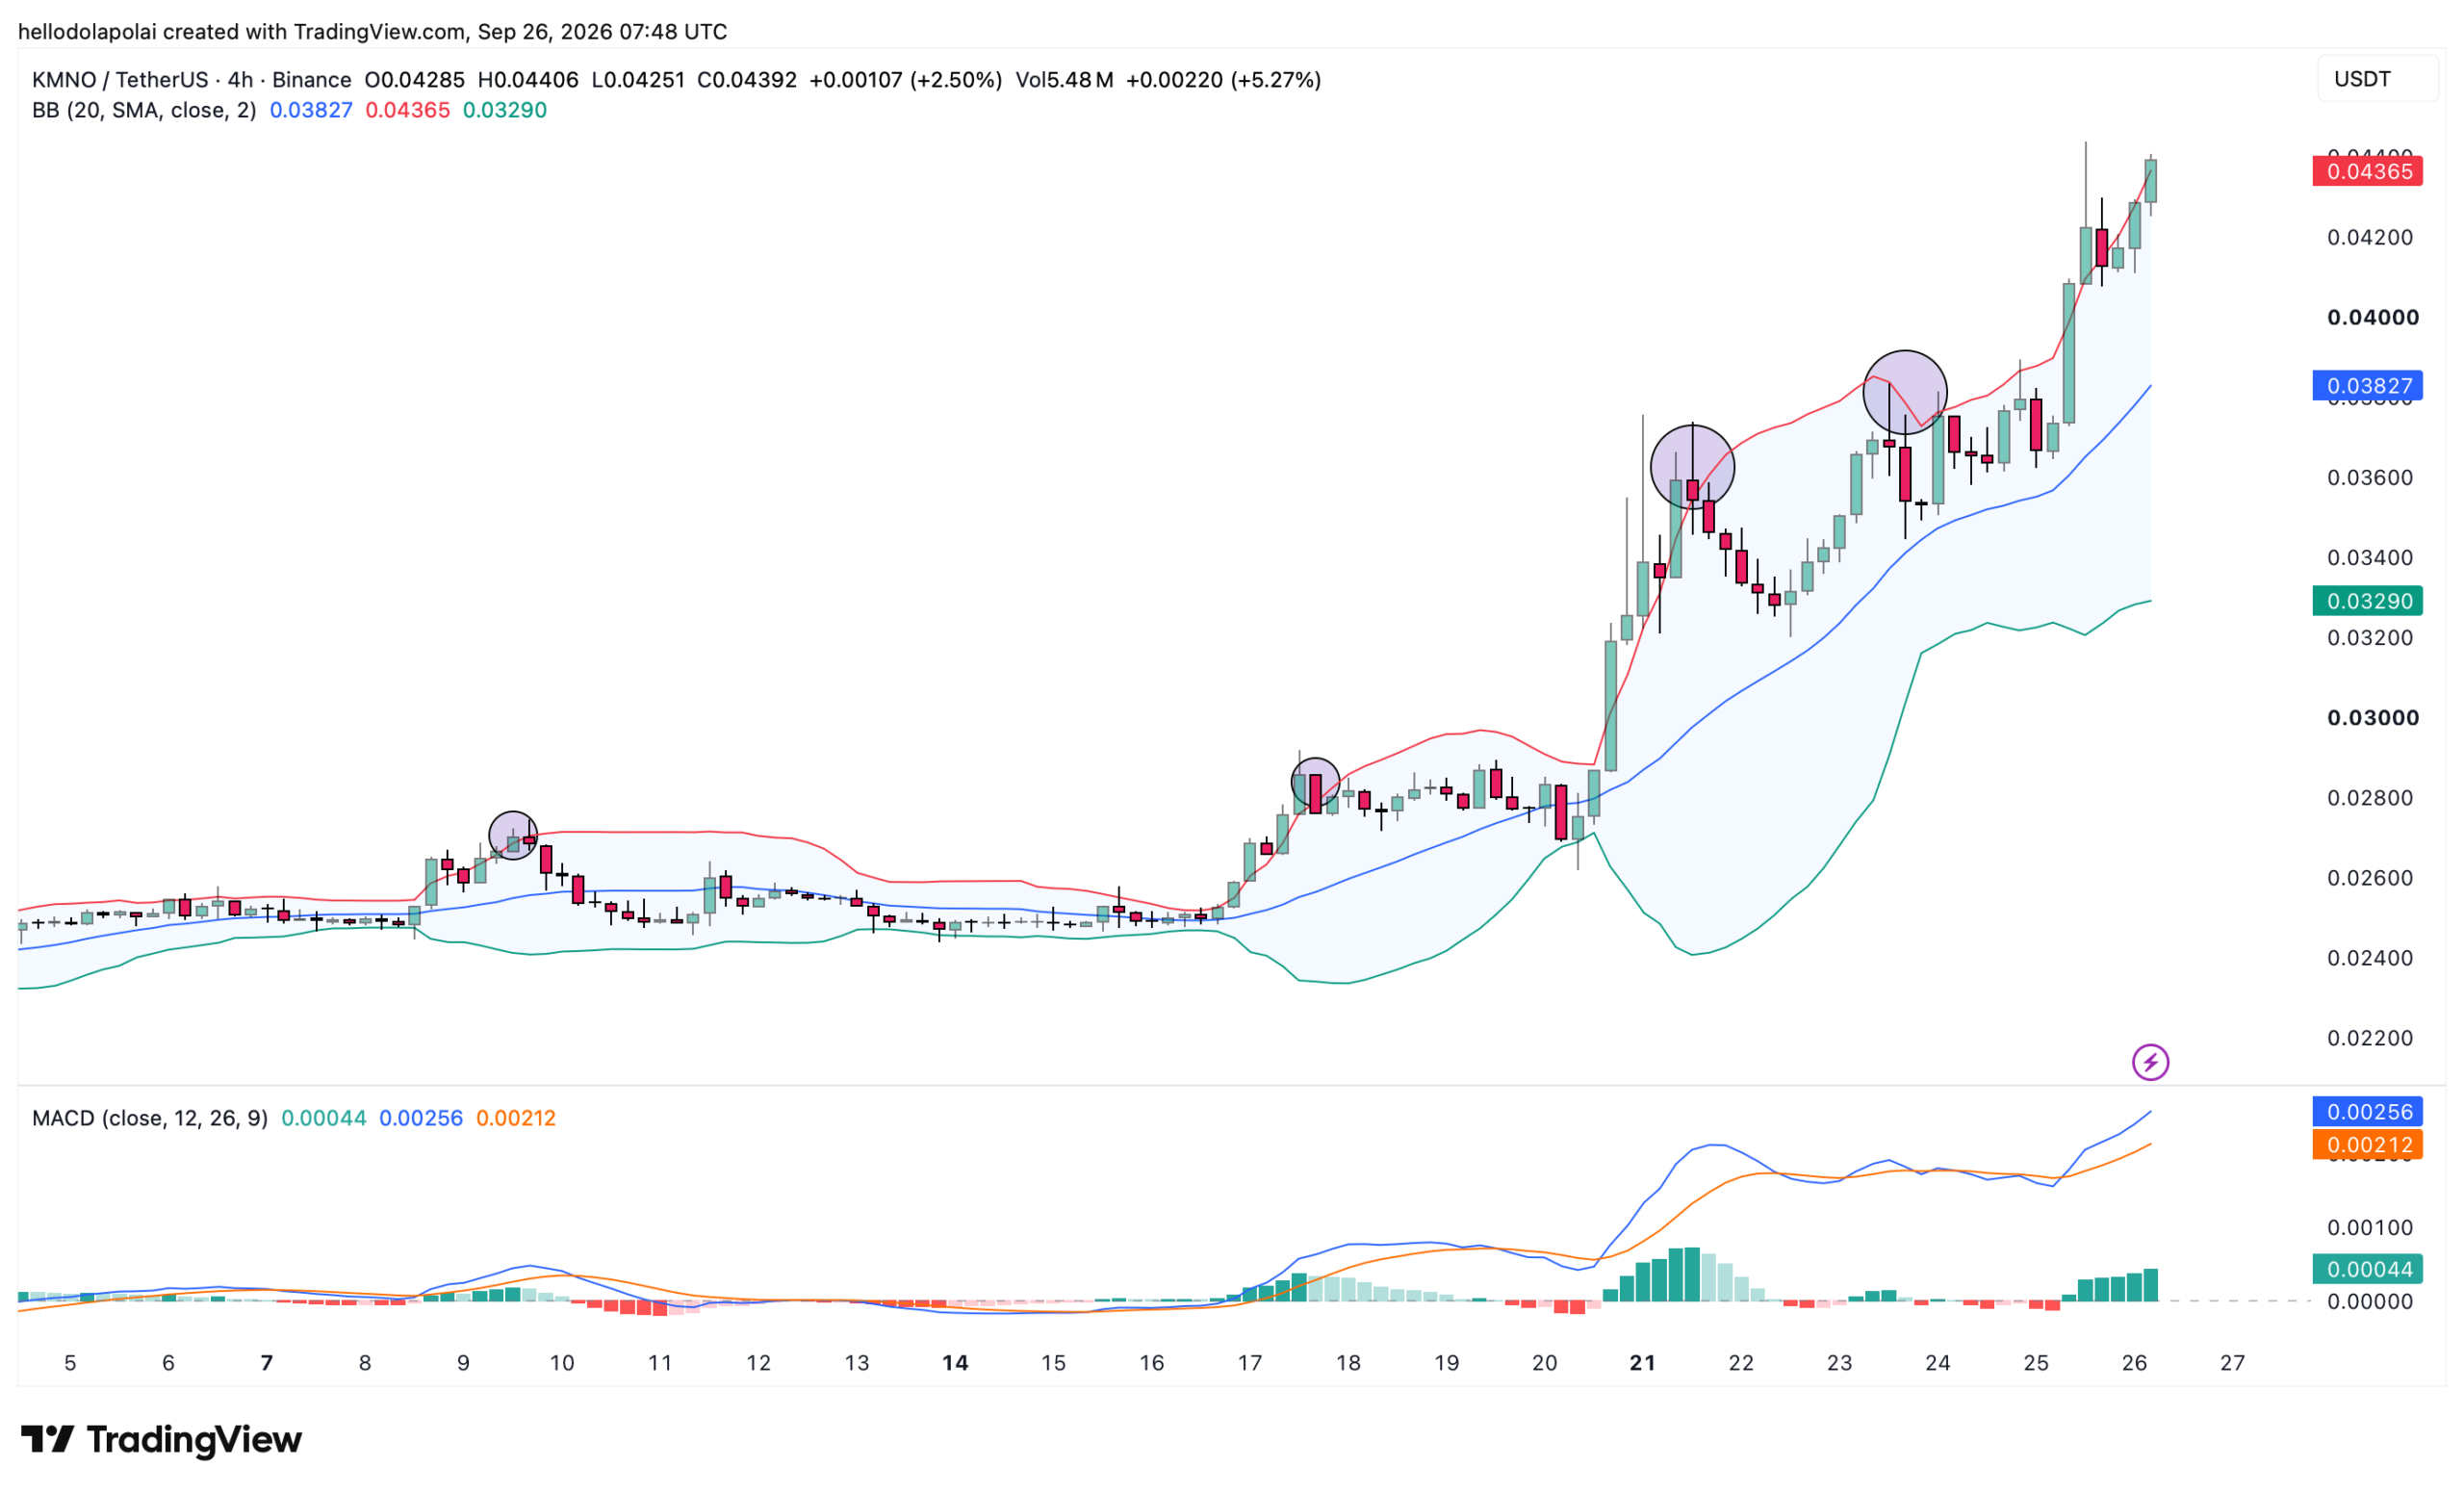
KMNO price chart and Indicators.KMNO price chart and Indicators.
Source: TradingView

Market momentum supports the upward move for the asset, with the Moving Average Convergence Divergence (MACD) seeing a rally to the upside while maintaining a strong position on the positive side.

The positive side of the market suggests that traders are heavily accumulating the asset, regardless of the warning that price is now overvalued.

KMNO’s on-chain growth strengthens the bull case

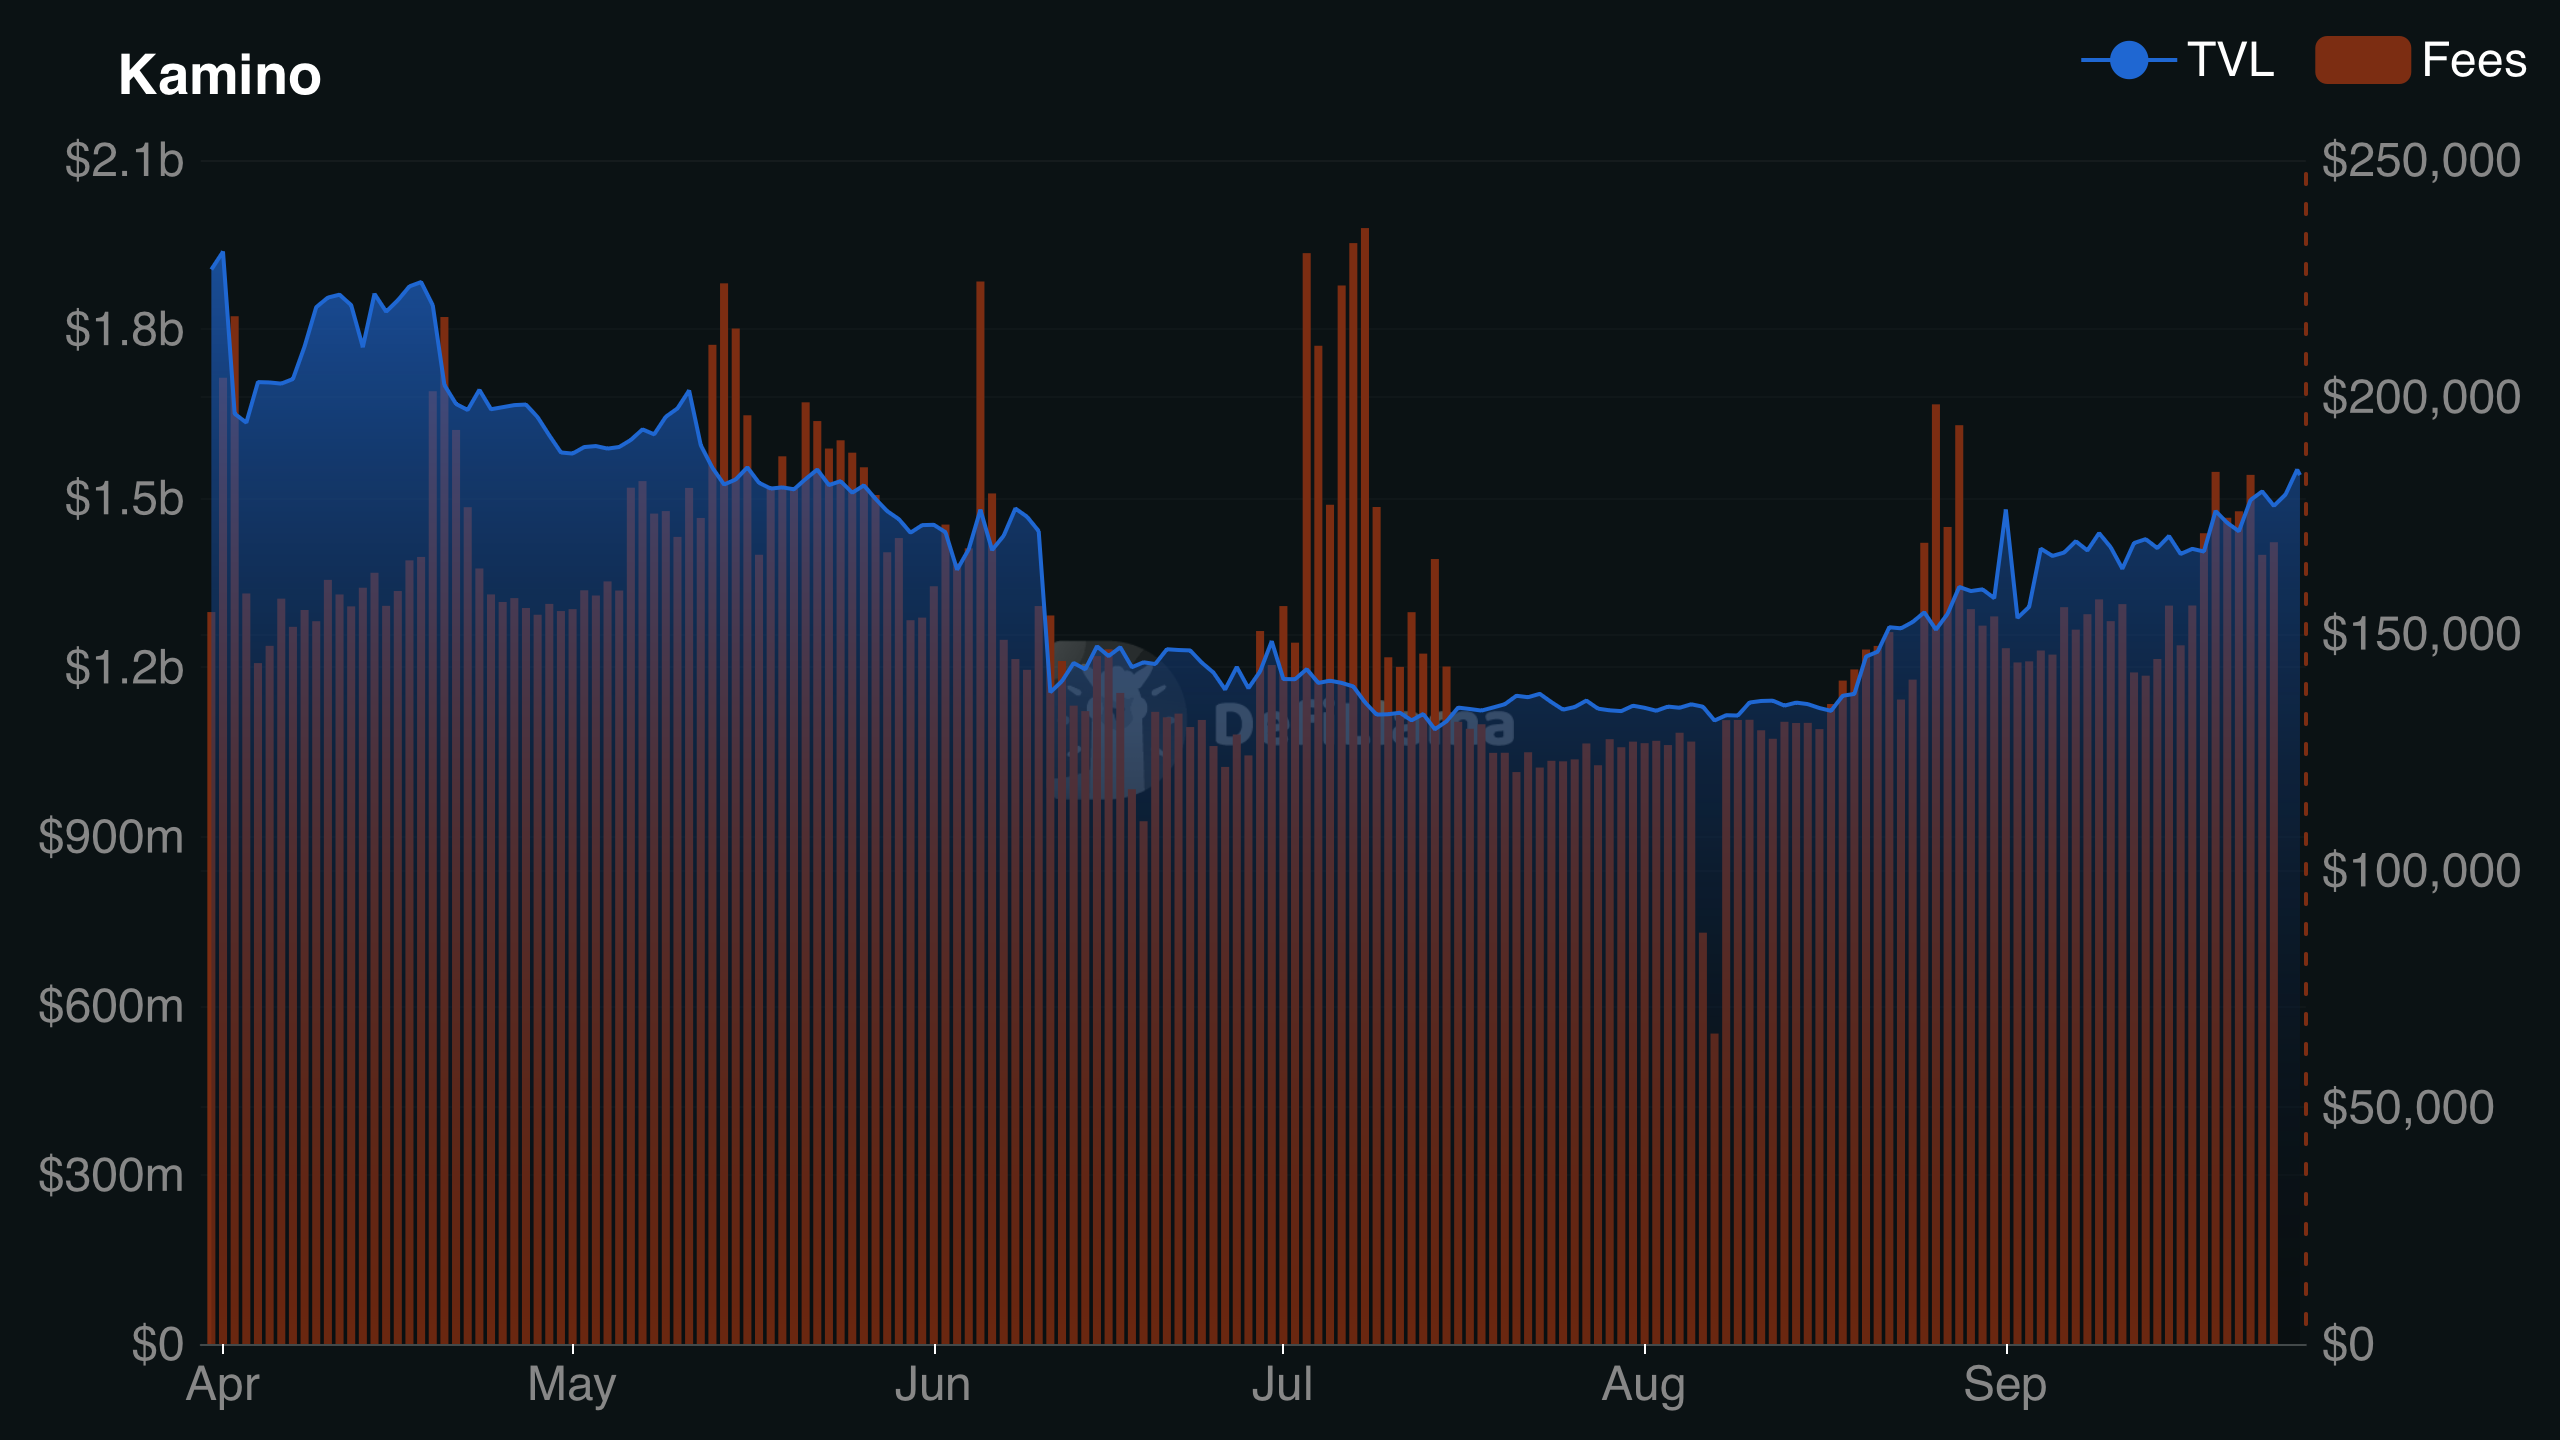
The on-chain flow in the market now suggests that the bullish sentiment isn’t just speculation, with activity on-chain backing its utility. According to DeFiLlama data, the Total Value Locked (TVL) has surged by over $253 million since September 2, reaching roughly $1.541 billion presently.

The surge in this TVL is a reflection of users in the market committing funds to earn APY as they anticipate long-term price appreciation. At the same time, the fees generated on the protocol have maintained steady growth, with over $169,000 reported as of the latest reading.
See also  Crypto Market Outlook: Top 4 Crypto Assets Whales Are Buying
Kamimo finance TVL and fee generated.Kamimo finance TVL and fee generated.
Source: DeFiLlama

When the protocol maintains steady fee generation, traders continue to use it, which can support a positive outlook for its price.

Spot trades have continued to back the price move through accumulation. There’s a marked accumulation when the Spot Netflow turns negative. CoinGlass Netflow analysis of spot traders shows that there’s been roughly $65,000 in net accumulation following a $3.5 million buy.

While this is negative, the gap between spot buyers and sellers remains slim, which means sellers can overcome buyers within that period, hence forcing the asset lower.
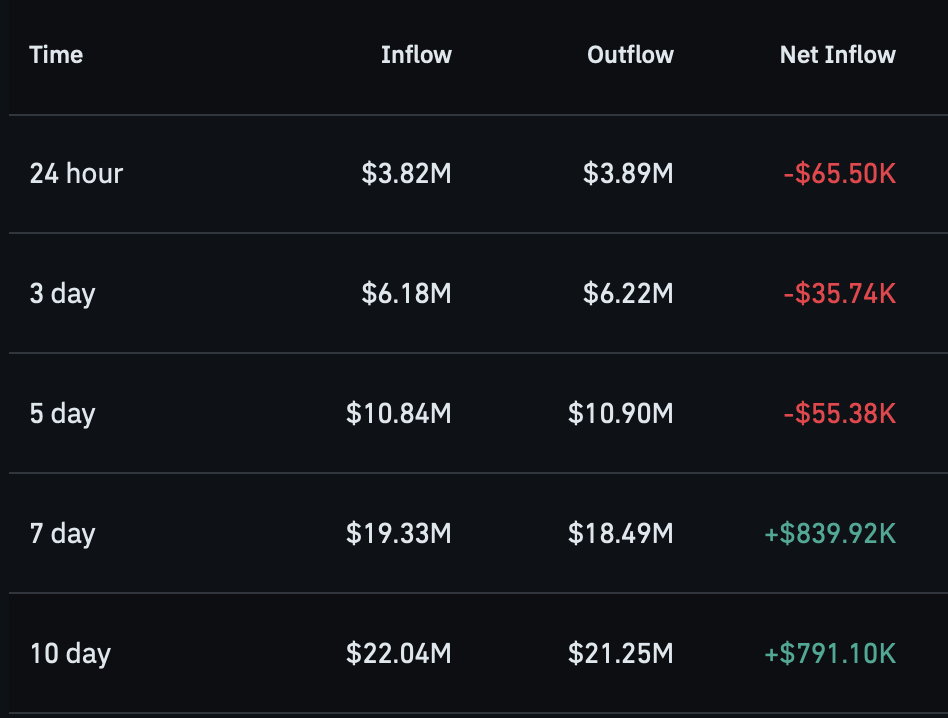
KMNO spot flow.KMNO spot flow.
Source: CoinGlass

Overall, the risk hasn’t been limited. A change in Spot Flow can be a signal to confirm whether investors are deciding to offload their assets, tallying with the bearish outlook.


Final Summary

  • KMNO’s 17% rally has pushed the token into the overbought zone, raising the risk of a pullback toward the mid-Bollinger Band.
  • On-chain activity and Spot Netflow continue to support accumulation, with TVL reaching $1.541 billion and roughly $65,000 in net spot accumulation.

Source link

bulls Finance gains indicator Kamino KMNO Watch
Share. Facebook Twitter Pinterest LinkedIn Tumblr Email

Related Posts

‘Under pressure’ Dogecoin down by 40%, but is more downside ahead for memecoin?

November 15, 2026

XRP price prediction — These TWO factors can help altcoin reclaim $1.2-level

November 15, 2026

Chainlink and Moody’s Test Cross-Chain Credit Ratings

November 15, 2026

2026 was supposed to be the year of altcoins – So what went wrong?

November 14, 2026
Add A Comment
Leave A Reply Cancel Reply

Top Posts

LiveRamp to Report Financial Results for First Quarter Fiscal 2027

July 22, 2026

IRCTC Launches NFT Train Tickets for Holi Festival 

March 15, 2024

BNB Chain to Upgrade Network in June

May 27, 2023

Subscribe to Updates

Get the latest creative news From Crypto Daily Pulse directly in your Inbox!

Our mission is to develop a community of people who try to make financially sound decisions. The website strives to educate individuals in making wise choices about Crypto, ICOs, Web3, Blockchain and more.

We're social. Connect with us:

Facebook X (Twitter) Instagram Pinterest YouTube
Top Insights

‘Under pressure’ Dogecoin down by 40%, but is more downside ahead for memecoin?

November 15, 2026

Supreme Court to decide tax bill for prediction market operators

November 15, 2026

Binance says stolen crypto has been replaced but some customers have to wait

November 15, 2026
Get Informed

Subscribe to Updates

Get the latest creative news From Crypto Daily Pulse directly in your Inbox!

  • Contact
  • Privacy Policy
  • Terms & Conditions
© 2026 Crypto Pulse Daily - All rights reserved.

Type above and press Enter to search. Press Esc to cancel.

Cleantalk Pixel
  • bitcoinBitcoin(BTC)$64,271.00-4.42%
  • ethereumEthereum(ETH)$1,788.78-5.81%
  • tetherTether(USDT)$1.000.04%
  • binancecoinBNB(BNB)$589.47-4.41%
  • usd-coinUSDC(USDC)$1.000.01%
  • rippleXRP(XRP)$0.95-3.49%
  • solanaSolana(SOL)$70.32-6.86%
  • tronTRON(TRX)$0.307134-1.72%
  • Figure HelocFigure Heloc(FIGR_HELOC)$1.071.87%
  • HyperliquidHyperliquid(HYPE)$65.41-6.29%