Close Menu
  • Latest News
    • Market
    • Altcoins
    • Legal and Regulatory
  • Tech
    • Blockchain
    • Security and Privacy
  • Web 3
    • Web3 News
    • NFTs
    • Gaming
  • Learn
    • Education
    • Investments
    • Staking
    • Wallets and Exchanges
  • ICOs
  • Mining
  • Crypto Tools
    • Exchange Tool
  • Shop
What's Hot

Crypto firms face July 1 EU cutoff as MiCA grace period ends

June 5, 2026

Bitcoin Faces Pressure As Investors Rotate Capital Into AI: Saylor

June 5, 2026

Brickken Expands Into Taiko, Boosting RWA Network Scalability, Interoperability With Ethereum L2 Scaling Solution

June 5, 2026
Facebook X (Twitter) Instagram
  • Contact
  • Privacy Policy
  • Terms & Conditions
Facebook X (Twitter) Instagram
CryptoPulseDaily.com
  • Latest News
    • Market
    • Altcoins
    • Legal and Regulatory
  • Tech
    • Blockchain
    • Security and Privacy
  • Web 3
    • Web3 News
    • NFTs
    • Gaming
  • Learn
    • Education
    • Investments
    • Staking
    • Wallets and Exchanges
  • ICOs
  • Mining
  • Crypto Tools
    • Exchange Tool
  • Shop
CryptoPulseDaily.com
Home»Market»Near Protocol (NEAR) Price Reaches 1000-Day Low
Market

Near Protocol (NEAR) Price Reaches 1000-Day Low

October 19, 2023No Comments3 Mins Read
Share
Facebook Twitter LinkedIn Pinterest Email

The Near Protocol (NEAR) price reached a low of $0.97 on October 19, falling below $1 for the first time since 2020. 

The Relative Strength Index (RSI) shows bearish signs in multiple timeframes. When will NEAR reach a bottom?

NEAR Finally Falls Below $1

The NEAR price has decreased since its all-time high price of $20.60 in January 2022. Initially, the price bounced at the start of 2023 but failed to initiate a bullish trend reversal. 

After breaking down from the $1.25 horizontal support area in August, the price continued its descent toward the $0.80 horizontal support.

On October 19, NEAR fell to a low of $0.97. This is a new 1000-day low for the price.

NEAR/USDT Weekly Chart. Source: TradingView

The weekly RSI provides a bearish reading. When evaluating market conditions, traders use the RSI as a momentum indicator to determine if a market is overbought or oversold and to decide whether to accumulate or sell an asset.

Bulls still have an advantage if the RSI reading is above 50 and the trend is upward. The opposite is true if the reading is below 50.

The indicator is below 50 and decreasing, both considered signs of a bearish trend.

NEAR Price Prediction: When Will Price Reach Bottom?

The technical analysis from the daily timeframe shows that the decrease since February has been contained inside a descending parallel channel. NEAR trades slightly below the channel’s resistance line at $1.

While the fact that the price trades in the channel’s upper portion can be considered bullish, the rest of the readings are bearish since the altcoin fell below the $1.10 minor support area.

See also  Bitcoin Price Stuck In Range But Here’s Why Bulls Are Safe?

Also, similarly to the weekly RSI, the daily one is falling and is below 50. If the decrease continues, the cryptocurrency can fall by another 16% and reach the $0.80 horizontal support area. 

NEAR Price Predictoin
NEAR/USDT Daily Chart. Source: TradingView

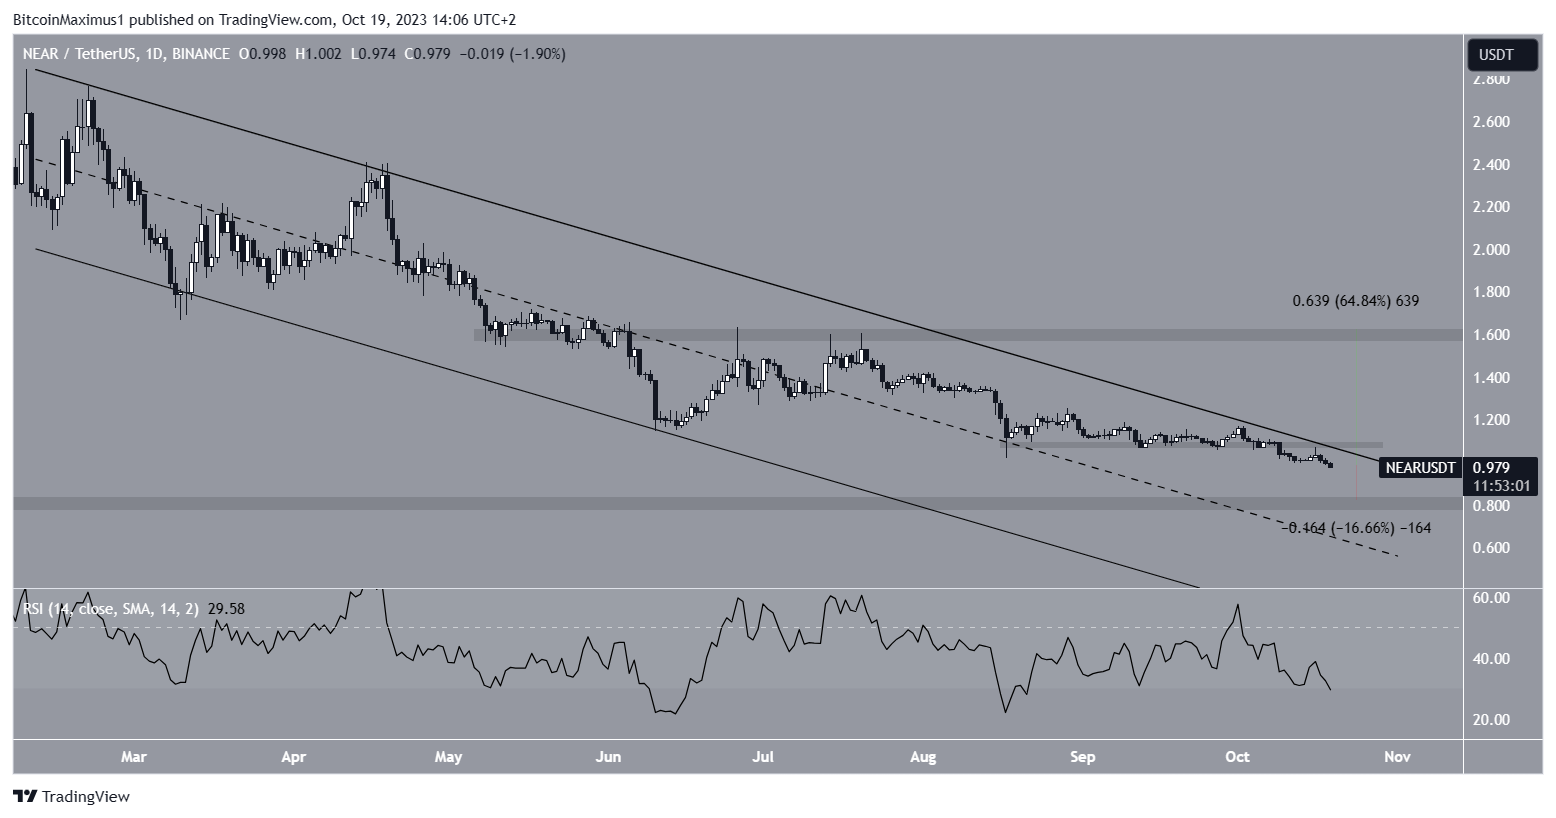
Despite this bearish NEAR price prediction, a breakout from the channel’s resistance line will mean that a bullish reversal has begun.

In that case, a 65% increase to the $1.60 resistance area will be expected.

For BeInCrypto’s latest crypto market analysis, click here.

Disclaimer

In line with the Trust Project guidelines, this price analysis article is for informational purposes only and should not be considered financial or investment advice. BeInCrypto is committed to accurate, unbiased reporting, but market conditions are subject to change without notice. Always conduct your own research and consult with a professional before making any financial decisions.

Source link

1000Day Price Protocol reaches
Share. Facebook Twitter Pinterest LinkedIn Tumblr Email

Related Posts

Bitcoin price prediction – Here’s why the real capitulation isn’t here yet!

June 5, 2026

Bitcoin could fall to $60,000, Zcash plunges 37%

June 5, 2026

Bitcoin Has a Built-In Price Floor Driven by Energy Costs

June 5, 2026

Crypto Clarity Act in spotlight for bad-actor provisions as Senate process grinds forward

June 5, 2026
Add A Comment
Leave A Reply Cancel Reply

Top Posts

Automata Network and Microsoft Azure Collaborate to Boost TEE Security

February 7, 2024

An Arctic Circle Bitcoin Mine Will Heat a Building in a Fishing Village

October 28, 2024

CoinFLEX creditors sue ex-CEO for helping Roger Ver avoid $84M debt

October 28, 2023

Subscribe to Updates

Get the latest creative news From Crypto Daily Pulse directly in your Inbox!

Our mission is to develop a community of people who try to make financially sound decisions. The website strives to educate individuals in making wise choices about Crypto, ICOs, Web3, Blockchain and more.

We're social. Connect with us:

Facebook X (Twitter) Instagram Pinterest YouTube
Top Insights

Crypto firms face July 1 EU cutoff as MiCA grace period ends

June 5, 2026

Bitcoin Faces Pressure As Investors Rotate Capital Into AI: Saylor

June 5, 2026

Brickken Expands Into Taiko, Boosting RWA Network Scalability, Interoperability With Ethereum L2 Scaling Solution

June 5, 2026
Get Informed

Subscribe to Updates

Get the latest creative news From Crypto Daily Pulse directly in your Inbox!

  • Contact
  • Privacy Policy
  • Terms & Conditions
© 2026 Crypto Pulse Daily - All rights reserved.

Type above and press Enter to search. Press Esc to cancel.

Cleantalk Pixel
  • bitcoinBitcoin(BTC)$61,896.00-2.93%
  • ethereumEthereum(ETH)$1,653.39-7.02%
  • tetherTether(USDT)$1.000.02%
  • binancecoinBNB(BNB)$590.03-2.22%
  • usd-coinUSDC(USDC)$1.000.00%
  • rippleXRP(XRP)$1.12-5.28%
  • solanaSolana(SOL)$65.59-6.43%
  • tronTRON(TRX)$0.325241-1.33%
  • Figure HelocFigure Heloc(FIGR_HELOC)$1.021.81%
  • HyperliquidHyperliquid(HYPE)$61.90-8.54%