Close Menu
  • Latest News
    • Market
    • Altcoins
    • Legal and Regulatory
  • Tech
    • Blockchain
    • Security and Privacy
  • Web 3
    • Web3 News
    • NFTs
    • Gaming
  • Learn
    • Education
    • Investments
    • Staking
    • Wallets and Exchanges
  • ICOs
  • Mining
  • Crypto Tools
    • Exchange Tool
  • Shop
What's Hot

What is a zero-knowledge proof? Privacy and scaling explained

August 3, 2026

Lite Strategy Funds $5.4M Buyback With Litecoin Sales And Covered Calls

August 3, 2026

Democrats Hate Crypto More Than Oil Companies and Data Centers, Poll Shows

August 3, 2026
Facebook X (Twitter) Instagram
  • Contact
  • Privacy Policy
  • Terms & Conditions
Facebook X (Twitter) Instagram
CryptoPulseDaily.com
  • Latest News
    • Market
    • Altcoins
    • Legal and Regulatory
  • Tech
    • Blockchain
    • Security and Privacy
  • Web 3
    • Web3 News
    • NFTs
    • Gaming
  • Learn
    • Education
    • Investments
    • Staking
    • Wallets and Exchanges
  • ICOs
  • Mining
  • Crypto Tools
    • Exchange Tool
  • Shop
CryptoPulseDaily.com
Home»Market»What to Make of the Shiba Inu (SHIB) Price Break Down?
Market

What to Make of the Shiba Inu (SHIB) Price Break Down?

January 23, 2024No Comments3 Mins Read
Share
Facebook Twitter LinkedIn Pinterest Email

The Shiba Inu (SHIB) price broke down from a short-term support but still holds above a long-term one.

Will it be enough to initiate a trend reversal, or will SHIB decrease below the long-term support?

Can Shiba Find Support?

The technical analysis of the weekly time frame shows that SHIB could not sustain its November 2023 breakout. At the time, the Shiba Inu price had broken out from a descending resistance trend line that had existed for nearly 500 days.

The upward movement led to a high of $0.000012 (red icon) before the price started falling.

Since then, the SHIB price has validated the resistance trend line twice (green icons) but failed to initiate any sort of bounce despite trading above the trend line.

SHIB/USDT Weekly Chart. Source: TradingView

The weekly RSI is leaning bearish, though it has not confirmed this yet. Traders utilize the RSI as a momentum indicator to assess whether a market is overbought or oversold and whether to accumulate or sell an asset.

If the RSI reading is above 50 and the trend is upward, bulls still have an advantage, but if the reading is below 50, the opposite is true. The indicator is falling but trades at 50 (red circle).

Read More: How To Buy Shiba Inu (SHIB) and Everything You Need To Know

SHIB Price Prediction: How Long Will Decrease Continue?

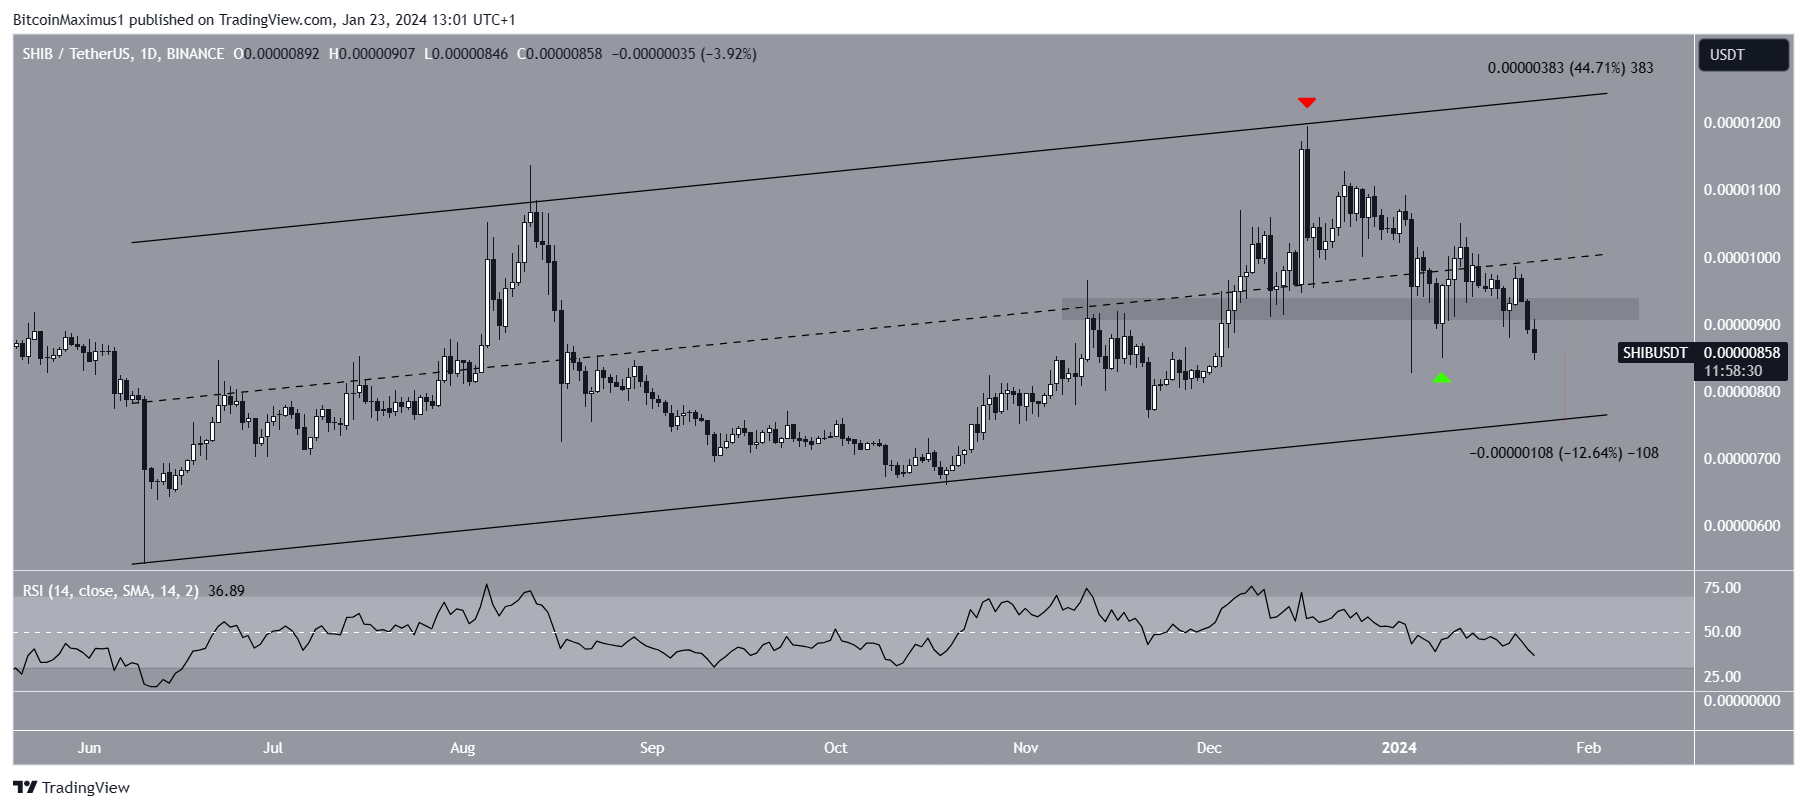
The technical analysis of the daily time frame aligns with the weekly one. It shows that the SHIB price has traded inside an ascending parallel channel since June 2023. The upward movement led to a high of $0.0000120 in December (red icon).

See also  Why Solana Breakpoint Event Could Push SOL Price Above $160

However, SHIB has fallen since the rejection. After briefly trading above the $0.0000092 area, SHIB broke down from it yesterday.

The daily RSI, which is below 50 and falling, supports the bearish price action. If the downward movement continues, SHIB can fall 12% to the channel’s support trend line at $0.00000800.
SHIB Price Prediction
SHIB/USDT Daily Chart. Source: TradingView

Despite the bearish SHIB price prediction, reclaiming the $0.0000092 area can trigger a 45% increase to the channel’s resistance trend line at $0.0000124.

Read More: Shiba Inu Burn Rate Explained: Understanding Token Burning

For BeInCrypto’s latest crypto market analysis, click here.

Disclaimer

In line with the Trust Project guidelines, this price analysis article is for informational purposes only and should not be considered financial or investment advice. BeInCrypto is committed to accurate, unbiased reporting, but market conditions are subject to change without notice. Always conduct your own research and consult with a professional before making any financial decisions. Please note that our Terms and Conditions, Privacy Policy, and Disclaimers have been updated.

Source link

Break Inu Price SHIB Shiba
Share. Facebook Twitter Pinterest LinkedIn Tumblr Email

Related Posts

Counting down the days: State of Crypto

August 3, 2026

A massive stablecoin fragmentation war is brewing between tech giants and a startup is aiming to capitalize on it

August 2, 2026

Bank of Italy research suggests stablecoins aren’t necessarily cheaper for remittances

August 2, 2026

Bitcoin cold-wallet attack spreads to 4,500 addresses as losses near $89 million

August 2, 2026
Add A Comment
Leave A Reply Cancel Reply

Top Posts

SEC dismisses rumors of chairman Gary Gensler’s resignation

July 3, 2023

Get Ready for the Farm Frens Airdrop: What You Need to Know

December 23, 2024

Blockchain powered Helium Mobile launches $5 unlimited decentralized data plan

August 16, 2023

Subscribe to Updates

Get the latest creative news From Crypto Daily Pulse directly in your Inbox!

Our mission is to develop a community of people who try to make financially sound decisions. The website strives to educate individuals in making wise choices about Crypto, ICOs, Web3, Blockchain and more.

We're social. Connect with us:

Facebook X (Twitter) Instagram Pinterest YouTube
Top Insights

What is a zero-knowledge proof? Privacy and scaling explained

August 3, 2026

Lite Strategy Funds $5.4M Buyback With Litecoin Sales And Covered Calls

August 3, 2026

Democrats Hate Crypto More Than Oil Companies and Data Centers, Poll Shows

August 3, 2026
Get Informed

Subscribe to Updates

Get the latest creative news From Crypto Daily Pulse directly in your Inbox!

  • Contact
  • Privacy Policy
  • Terms & Conditions
© 2026 Crypto Pulse Daily - All rights reserved.

Type above and press Enter to search. Press Esc to cancel.

Cleantalk Pixel
  • bitcoinBitcoin(BTC)$62,853.00-0.90%
  • ethereumEthereum(ETH)$1,857.87-1.00%
  • tetherTether(USDT)$1.000.00%
  • binancecoinBNB(BNB)$583.370.40%
  • usd-coinUSDC(USDC)$1.000.00%
  • rippleXRP(XRP)$1.07-0.40%
  • solanaSolana(SOL)$72.90-0.40%
  • tronTRON(TRX)$0.325846-0.70%
  • Figure HelocFigure Heloc(FIGR_HELOC)$1.00-3.10%
  • whitebitWhiteBIT Coin(WBT)$54.70-1.00%