
Jane Street sharply reduced its Bitcoin ETF exposure in the first quarter of 2026, cutting reported holdings in BlackRock’s IBIT and Fidelity’s FBTC while increasing positions in Ether ETFs and several crypto-linked equities. The move has revived speculation that one of the market’s largest trading firms may have been a major force in Bitcoin’s recent price dynamics — and that a lighter reported position could remove a key overhang for BTC.
According to the latest 13F filings, Jane Street cut its IBIT position by roughly 71% and its FBTC position by about 60% in Q1. Parker White, the Chief Operating Officer (COO) and Chief Investment Officer (CIO) of DeFi Development Corp (DFDV), renewed his thesis from February and argued via X that the filing may help answer questions that have circulated since a major IBIT trading dislocation on February 5 when BTC price saw a massive -18% drawdown.
“It is now apparent that Jane Street cut their IBIT and FBTC holdings by roughly 70% in Q1 based on 13F filings,” Parker wrote on X. “Did they just outright sell or more likely, did they make a HUGE profit on their short derivatives, which they don’t have to report? We are still waiting for the final shoe to drop with one of the likely culprits of the blowup.”
It is now apparent that Jane Street cut their IBIT and FBTC holdings by roughly 70% in Q1 based on 13F filings. Did they just outright sell or more likely, did they make a HUGE profit on their short derivatives (which they don’t have to report)?
We are still waiting for the… https://t.co/67XxlwZEGm
— Parker (@TheOtherParker_) May 13, 2026
Related Reading
Will The Bitcoin Price Rally Now?
The filing does not show Jane Street’s derivatives exposure, nor does it establish whether the firm was directionally bearish, hedged, or engaged in ETF arbitrage and market-making activity. That limitation is central to the debate. A 13F captures certain long holdings at quarter-end, but it does not give a complete view of options, swaps, futures, or short exposure that could materially change the economic interpretation of the reported cuts.
Still, the reduction has become a focal point because of earlier claims that Bitcoin’s price discovery may have been distorted by the mechanics of spot ETF trading. Bitwise advisor Jeff Park wrote that Jane Street had “slashed its Bitcoin ETF exposure in Q1 2026,” cutting IBIT by approximately 71% and FBTC by approximately 60%, before adding: “Price discovery is back on the menu.”
Park’s broader argument is not that one firm explicitly suppressed Bitcoin’s price, but that the ETF structure creates a complex market-making environment in which authorized participants can use creation and redemption mechanics, derivatives, and futures hedges in ways that may weaken the link between ETF demand and spot Bitcoin buying. In a prior post, he framed the issue as structural rather than conspiratorial.
JANE STREET SLASHED ITS BITCOIN ETF EXPOSURE IN Q1 2026, CUTTING IBIT BY ~71% AND FBTC BY ~60%, ACCORDING TO ITS LATEST 13F FILING
Price discovery is back on the menu https://t.co/ed41KhlQC4
— Jeff Park (@dgt10011) May 13, 2026
“The short answer is that no AP explicitly suppresses Bitcoin price,” Park wrote. “What the AP structure can suppress is the integrity of the price discovery mechanism itself. Those are not the same thing—but the second is arguably more consequential than the first.”
Related Reading
That distinction matters for the bullish interpretation. If Jane Street’s reported Bitcoin ETF exposure has already been reduced substantially, some traders may read the filing as evidence that a large source of ETF-related pressure has been partially cleared. Parker went further, suggesting Jane Street “likely doesn’t want to be short BTC forever” and that observers should “look for them to begin re-accumulating in Q2.”
The thesis is speculative, but it is not without a clear market logic. If a large trading firm had been involved in strategies that created persistent ETF or derivatives pressure, a reduction in reported Bitcoin ETF holdings, combined with any eventual unwind of related positions, could shift the market’s balance back toward cleaner spot-led price discovery. That is the bullish setup implied by the posts: not simply that Jane Street sold, but that the trade may already have played out.
At the same time, Jane Street did not exit crypto exposure broadly. The firm increased holdings in BlackRock and Fidelity Ether ETFs and added to positions in Riot Platforms, Coinbase, and Galaxy Digital, while trimming Strategy and several Bitcoin mining names.
At press time, BTC traded at $79,783.
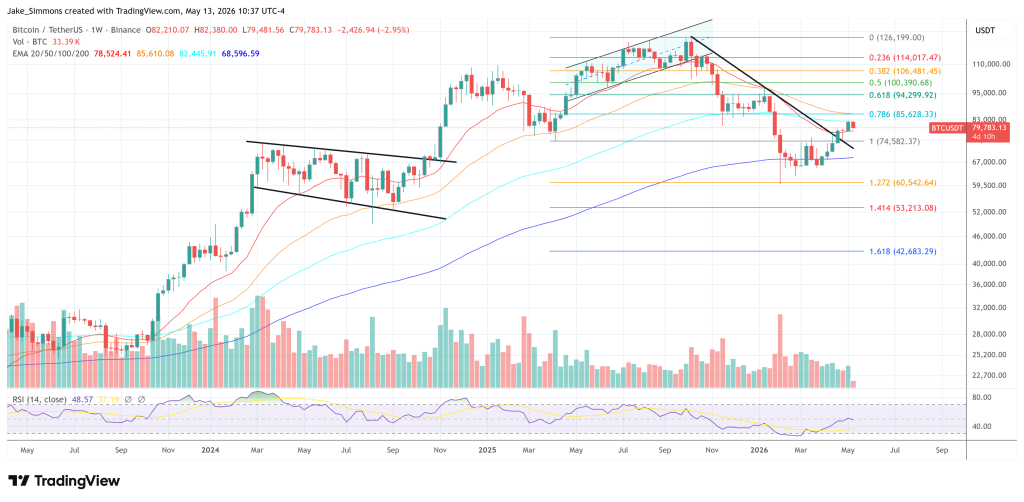
Featured image created with DALL.E, chart from TradingView.com


