
Close Menu
  • Latest News
    • Market
    • Altcoins
    • Legal and Regulatory
  • Tech
    • Blockchain
    • Security and Privacy
  • Web 3
    • Web3 News
    • NFTs
    • Gaming
  • Learn
    • Education
    • Investments
    • Staking
    • Wallets and Exchanges
  • ICOs
  • Mining
  • Crypto Tools
    • Exchange Tool
  • Shop
What's Hot

HKMA and Swift explore tokenized deposits for cross-border payments

November 17, 2026

Zcash price eyes $940 – Can ZEC turn its relief rally into a recovery?

November 17, 2026

Bernstein Sets $30 Target on Riot Platforms (RIOT) on $38B AI Contracts

November 17, 2026
Facebook X (Twitter) Instagram
  • Contact
  • Privacy Policy
  • Terms & Conditions
Facebook X (Twitter) Instagram
CryptoPulseDaily.com
  • Latest News
    • Market
    • Altcoins
    • Legal and Regulatory
  • Tech
    • Blockchain
    • Security and Privacy
  • Web 3
    • Web3 News
    • NFTs
    • Gaming
  • Learn
    • Education
    • Investments
    • Staking
    • Wallets and Exchanges
  • ICOs
  • Mining
  • Crypto Tools
    • Exchange Tool
  • Shop
CryptoPulseDaily.com
Home»Altcoins»Will Pi Network face further losses? Why THESE signals say yes
Altcoins

Will Pi Network face further losses? Why THESE signals say yes

September 17, 2026No Comments3 Mins Read
Share
Facebook Twitter LinkedIn Pinterest Email

Pi Network [PI] has been on the decline, with roughly 13% of the asset’s value dropping as of writing.

The decline followed the stretch of losses witnessed across the crypto market within the same period. The typical question now is what comes next as the coin may see further losses.

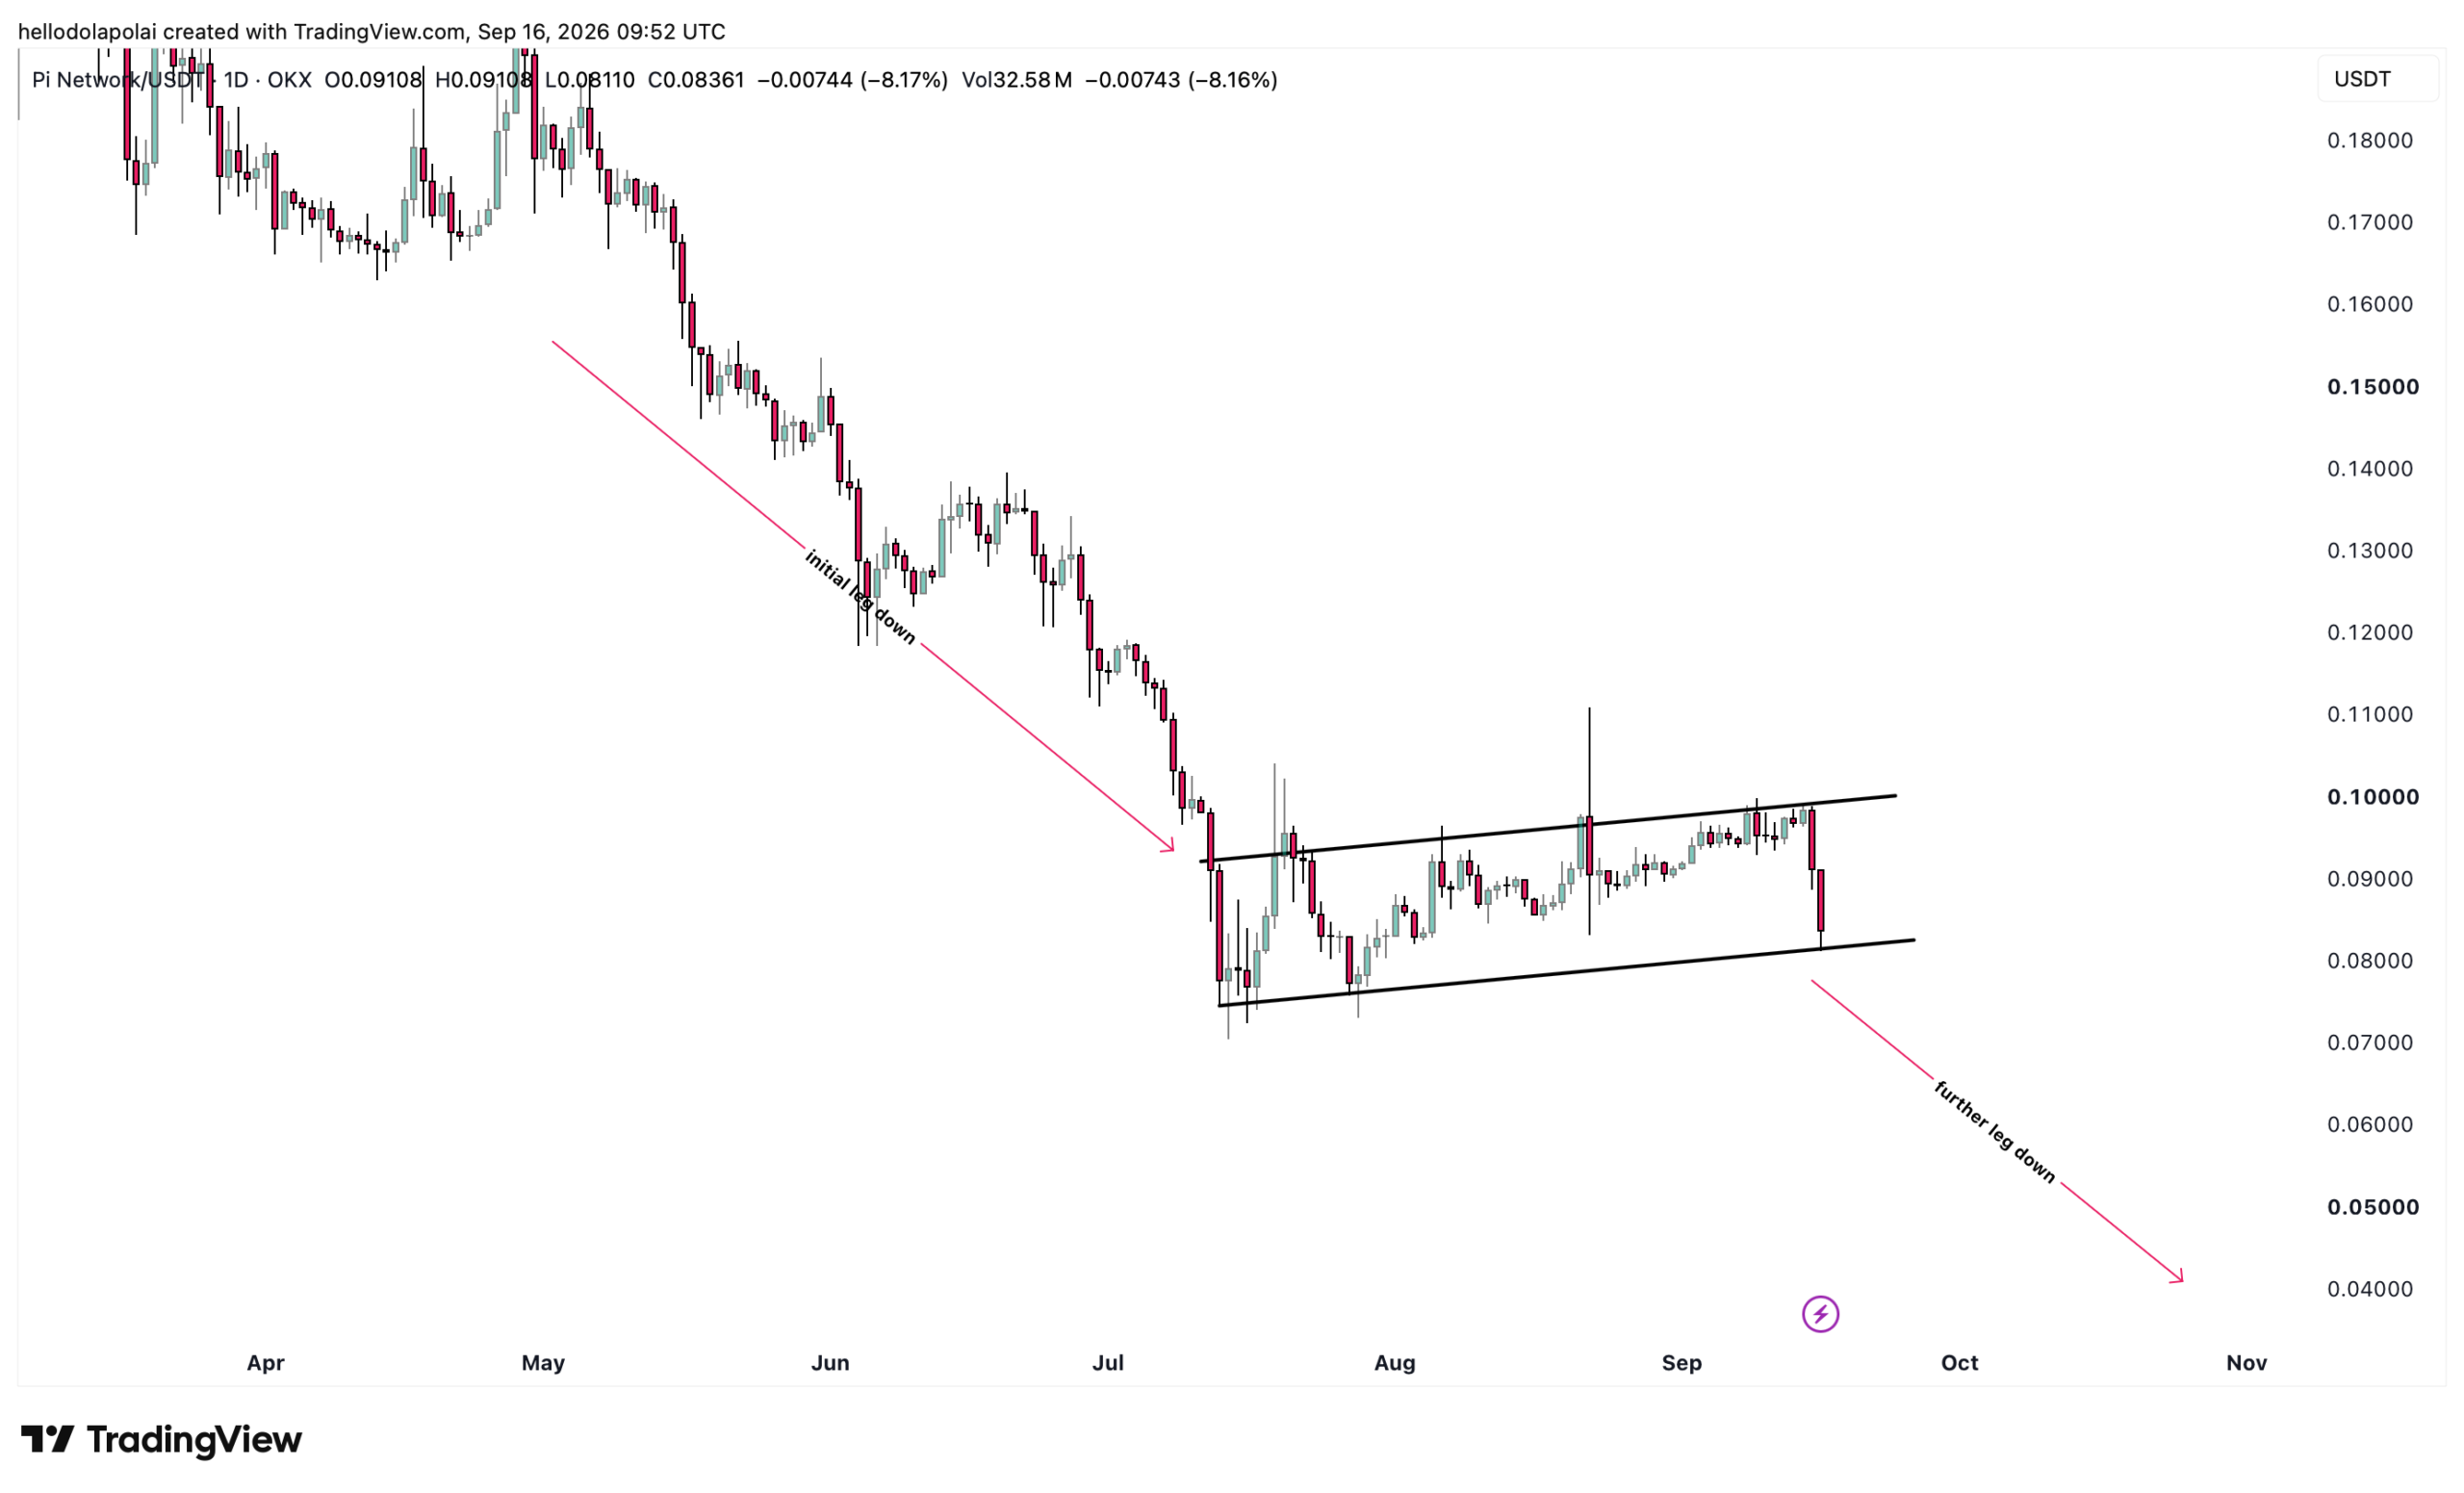
Chart analysis of PI gives the clearest insight into why a drop could be near, particularly as the asset is trading within a bearish flag pattern.
PI price chart.PI price chart.
Source: TradingView

The pattern forms when an asset initially sees a leg down in the market, then consolidates within descending but parallel support and resistance lines, followed by another leg down.

Currently, PI has passed the first stage, and it’s consolidating. But what’s more important is that it’s testing the support. The support line is a critical level for whether the asset sees a decline beginning to form the lower leg, consolidates further, or invalidates the pattern entirely.

The case for PI, presently, is that the indicators show a leg down could be closer, and traders may need to brace themselves for it.

Bearish momentum continues to mount

There’s clear bearish momentum showing that PI is likely to see a further decline in the near term.

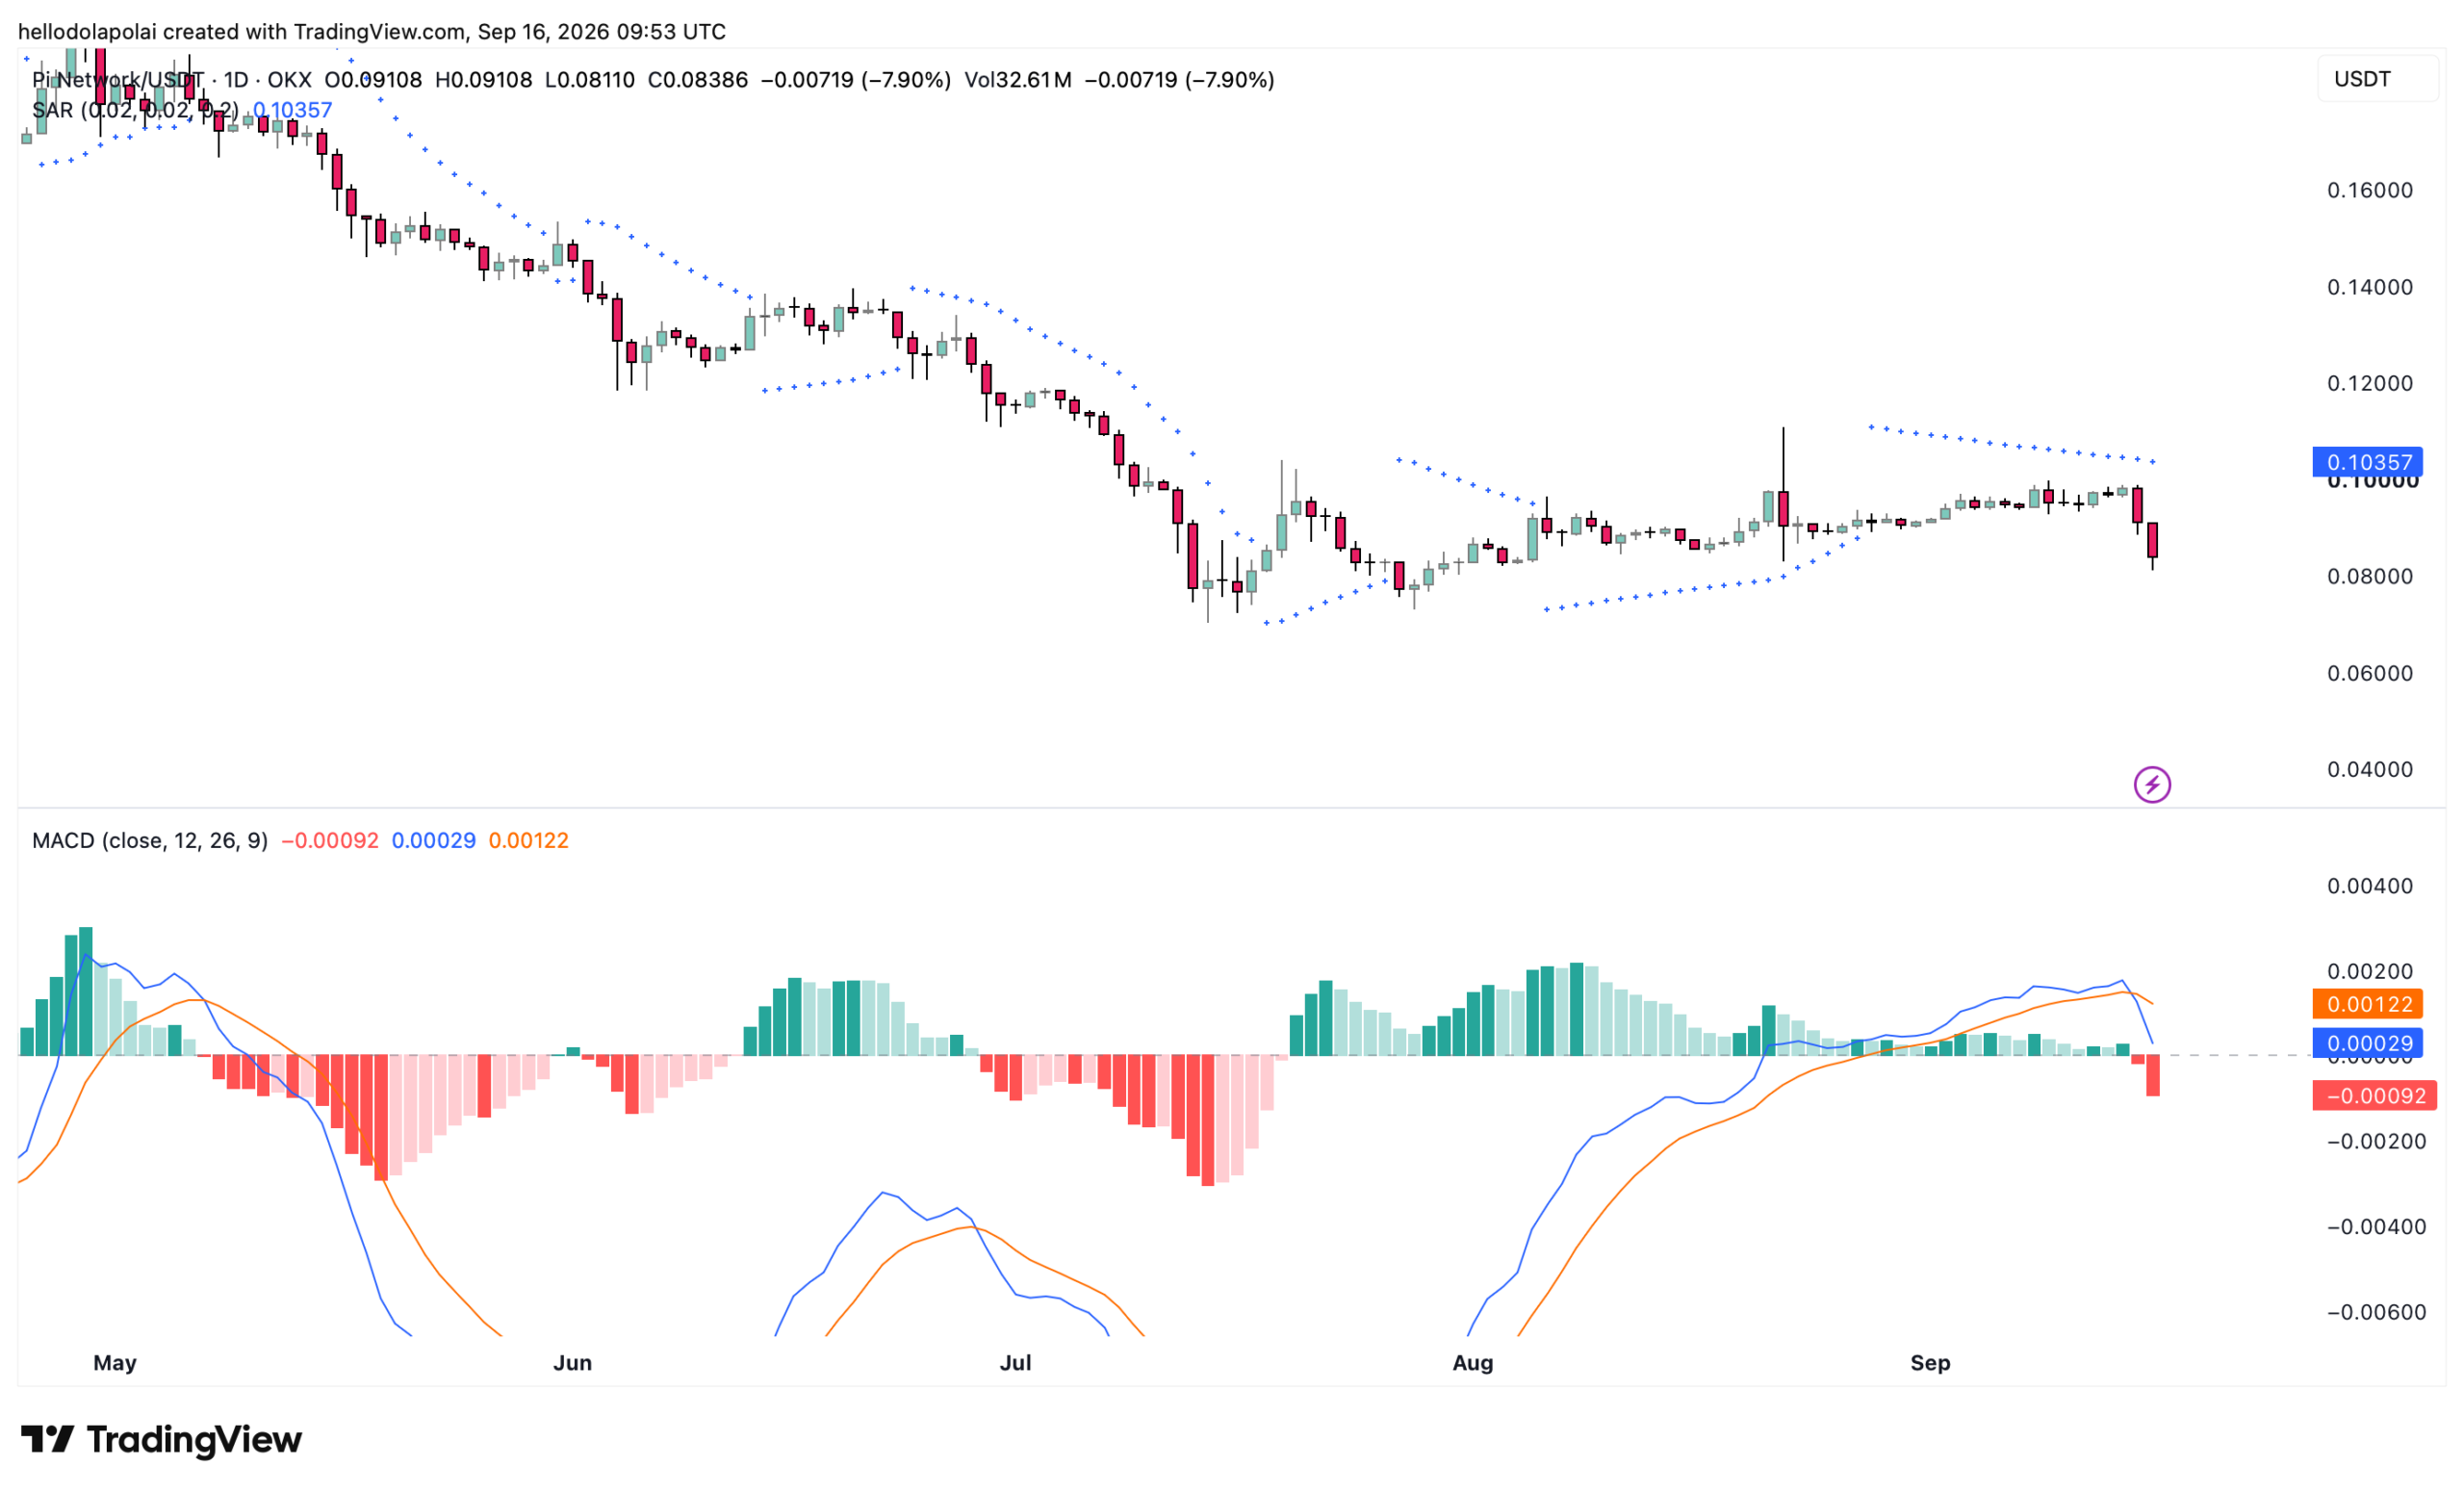
One of the indicators pointing to this is the Parabolic Stop and Reverse (SAR), which uses dots to determine trends and momentum. The placement of dots above price implies strong selling pressure, adding to the chances that price drops further.

This adds to the chances that the asset, trading on the edge, could still witness a further drop in the near term. Adding to this is the Moving Average Convergence and Divergence (MACD).

See also  Can VIRTUAL extend its rally? THESE signals offer clues

At press time, the MACD has just formed a ‘Death Cross’ pattern, which is based on the blue MACD line crossing below the orange signal line on the chart, indicating that sellers are more dominant.
PI indicator chart.PI indicator chart.
Source: TradingView

The expanding red histogram bars suggest that price could continue moving lower, with more losses likely to follow.

Once both lines cross into the negative side of the chart, there’s a higher chance that the losses on PI intensify even further, with the asset declining and potentially dropping below the support level.

The sentiment shows clear selling pressure

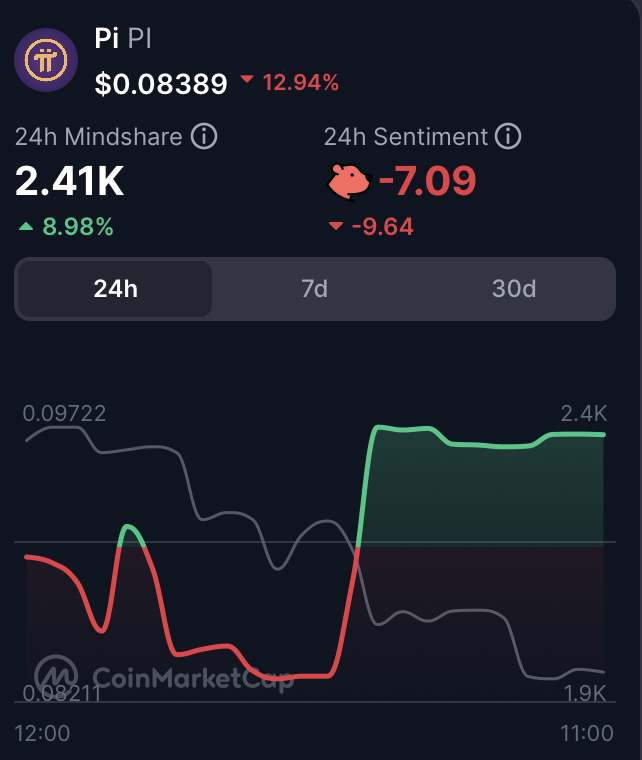
The Sentiment tracker by CoinMarketCap shows that the consensus among investors in the market is clearly bearish.

This tracker works by using a scale between -10 and 10 to determine where investors fall. The closer the reading is to either extreme, the stronger the bullish or bearish sentiment in the market.

For PI, the Sentiment has a reading of negative -7.09 at the time of writing, which ultimately implies that investors are more likely to sell.
PI market sentiment chart.PI market sentiment chart.
Source: CoinMarketCap

The market sentiment is close to the extreme, while growing mindshare could limit a price rebound and increase the risk of a further drop. For now, investors need to be cautious as PI is now in a more volatile state in the market.


Final Summary

Source link

Face Losses Network Signals
Share. Facebook Twitter Pinterest LinkedIn Tumblr Email

Related Posts

Zcash price eyes $940 – Can ZEC turn its relief rally into a recovery?

November 17, 2026

Aave V4 deposits hit a record $1.75B – Now traders are watching THIS range

November 17, 2026

Wells Fargo Reports $2.35 Billion in BlackRock Bitcoin ETF Shares, but the Filing Needs Context

November 17, 2026

Seven straight red weeks! Can Sui avoid a steep drop towards $0.65 lows?

November 17, 2026
Add A Comment
Leave A Reply Cancel Reply

Top Posts

Tether Founder Paolo Ardoino Says US Is Dropping the Ball on Crypto Regulation Amid Run-Up to Election

October 24, 2024

Crypto lobbying orgs ask court to suspend Illinois tax as legal case continues

September 10, 2026

RWA Inc. and Plume Network Collaborate to Transform the Tokenization Sector

May 1, 2024

Subscribe to Updates

Get the latest creative news From Crypto Daily Pulse directly in your Inbox!

Our mission is to develop a community of people who try to make financially sound decisions. The website strives to educate individuals in making wise choices about Crypto, ICOs, Web3, Blockchain and more.

We're social. Connect with us:

Facebook X (Twitter) Instagram Pinterest YouTube
Top Insights

HKMA and Swift explore tokenized deposits for cross-border payments

November 17, 2026

Zcash price eyes $940 – Can ZEC turn its relief rally into a recovery?

November 17, 2026

Bernstein Sets $30 Target on Riot Platforms (RIOT) on $38B AI Contracts

November 17, 2026
Get Informed

Subscribe to Updates

Get the latest creative news From Crypto Daily Pulse directly in your Inbox!

  • Contact
  • Privacy Policy
  • Terms & Conditions
© 2026 Crypto Pulse Daily - All rights reserved.

Type above and press Enter to search. Press Esc to cancel.

Cleantalk Pixel
  • bitcoinBitcoin(BTC)$64,226.00-1.77%
  • ethereumEthereum(ETH)$1,801.06-1.63%
  • tetherTether(USDT)$1.00-0.02%
  • binancecoinBNB(BNB)$590.10-0.68%
  • usd-coinUSDC(USDC)$1.00-0.01%
  • rippleXRP(XRP)$0.970.74%
  • solanaSolana(SOL)$73.331.94%
  • tronTRON(TRX)$0.3072690.66%
  • Figure HelocFigure Heloc(FIGR_HELOC)$1.01-3.71%
  • HyperliquidHyperliquid(HYPE)$68.62-2.93%